


This is the final post in a series of blog posts looking at how you can use our risk intelligence to understand more about your organization’s overall risk level, to learn how your current safety programs influence risk, and to identify ways to reduce driving risk further.
If you haven’t yet read the other posts, please check out Part One and Part Two. Otherwise, read on to discover how to use AI risk intelligence into road safety to transform your approach to driver training and ongoing risk management.
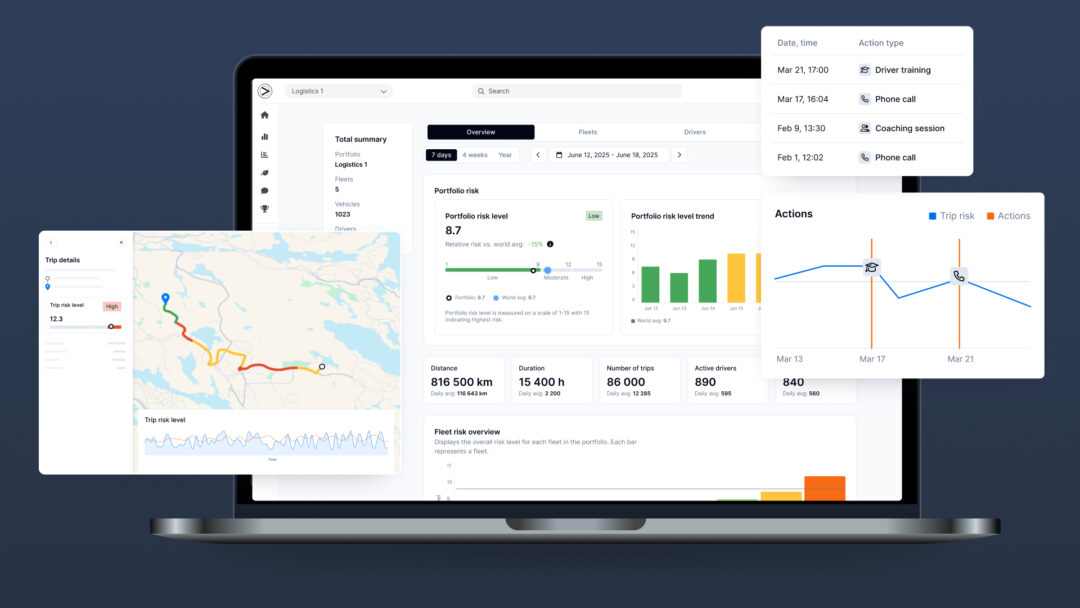
Different companies have different capacities and approaches when it comes to driver training. Do you currently have a structure as to how you select drivers for training, or are they chosen at random? If, for example, you can train 5% of drivers every week, our Crash Probability Tool will provide a list of the 5% highest risk drivers every week, along with reasons for risk level, trends in risk level, and recommendations to reduce risk.
These new insights enable you to provide the right intervention, at the right time, to the right drivers. Going forward, this gives you the confidence that you are selecting the drivers for training who need it most, making your training more effective and delivering an improved ROI from your existing resources.
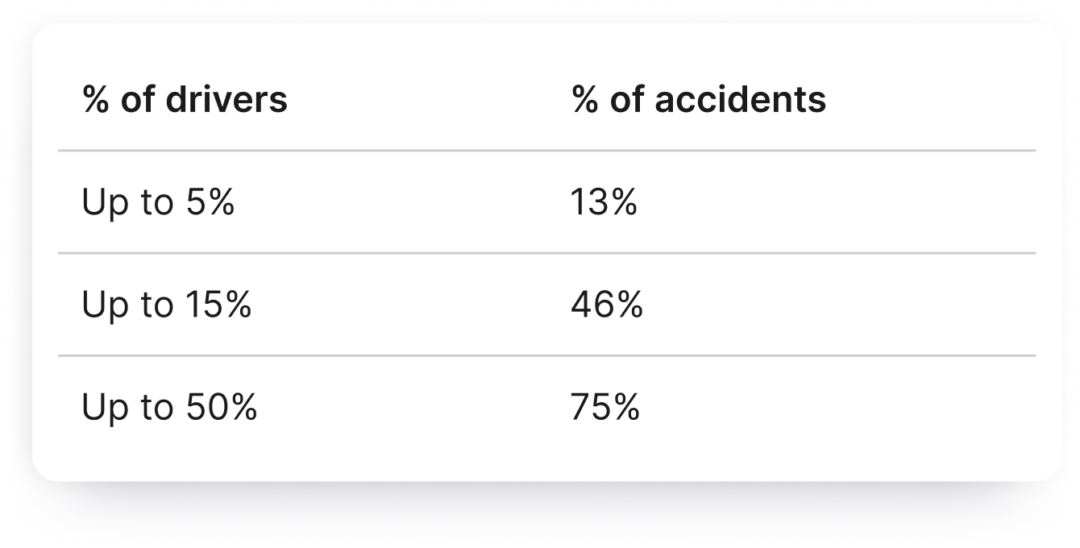
Powerful predictions: The Crash Probability Tool can determine the % of crashes caused by a set % of drivers. This means you can focus your efforts on those drivers, helping to mitigate a high proportion of crashes.
Example of insights you might receive:
Our risk intelligence allows your company to gain a completely new perspective on risk. You might already have big plans to reduce crashes and great ideas for safety programs, but are you able to measure their impact on crash risk?