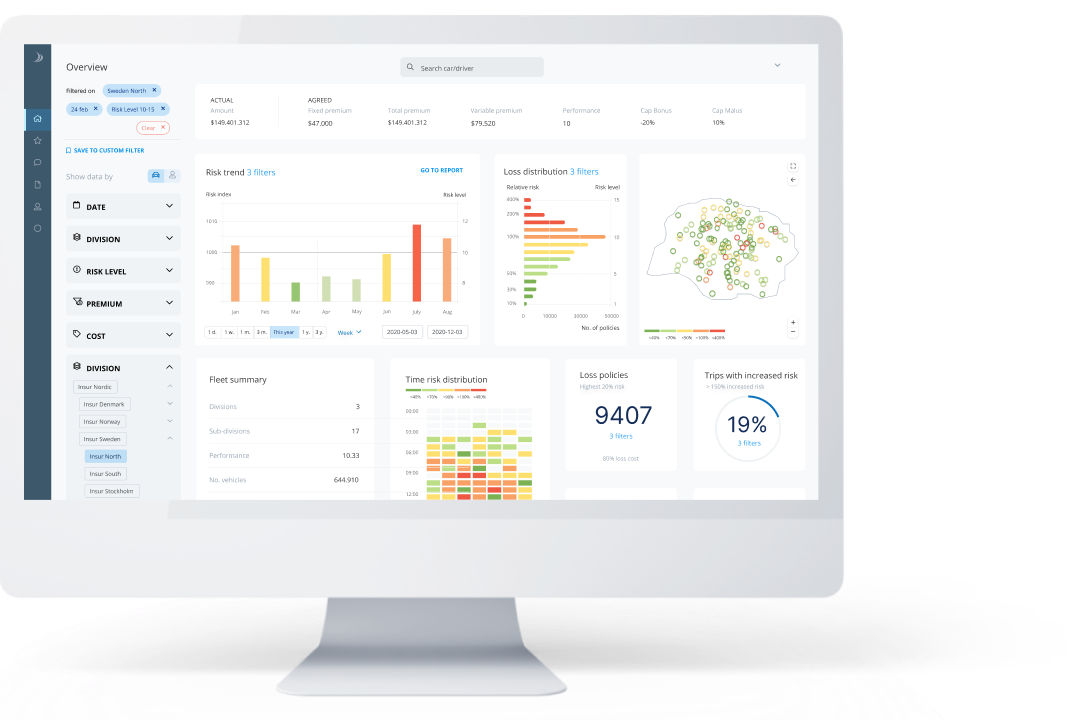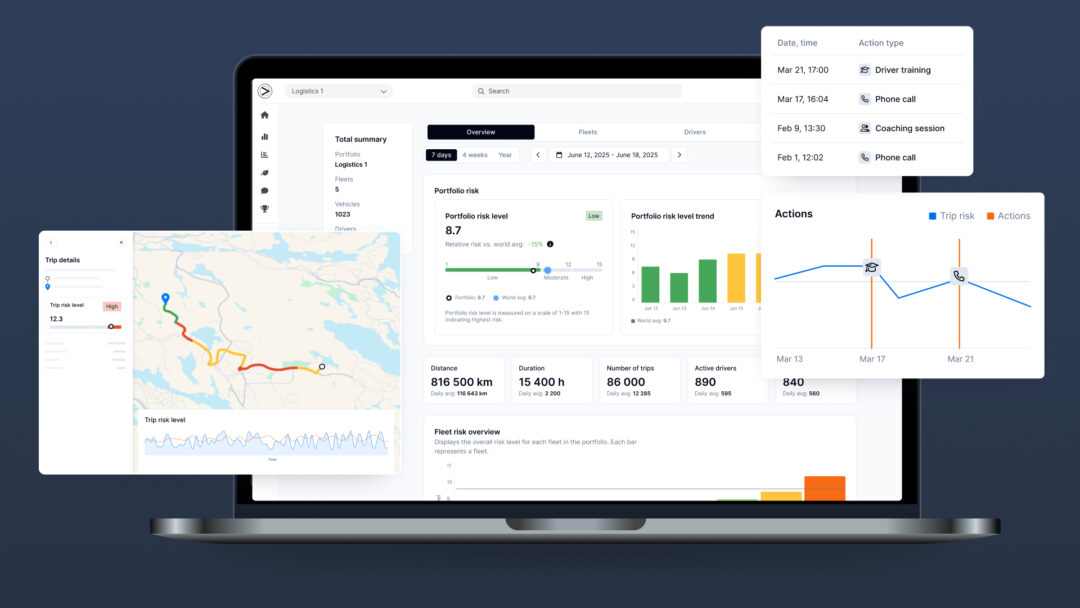


Elevate your understanding of driving risk with real-time crash probability insights. Compare risk across times, days, locations and many other factors, with the ability to dive deep into individual drivers and trips. Quickly identify changes in risk, and reasons why.
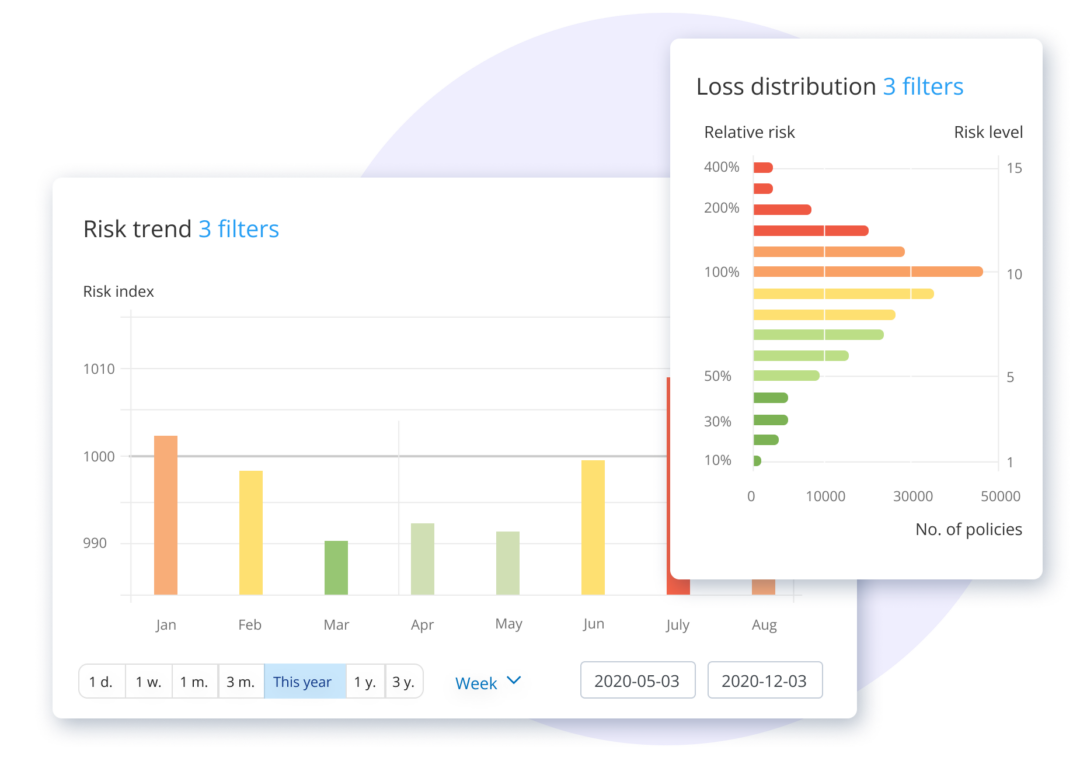
From top level down, see how your entire driving population contributes to risk level. Understand the factors influencing crash probability and identify areas requiring attention. Benefits:
Greater Than’s platform is excellent for providing valuable risk intelligence that can identify a driver’s influence on safety. This is very powerful for fleets as it helps them see where improvements can be made that will positively influence their safety performance.
Jim Davis
VP, Insurance & Risk Management, Waylens

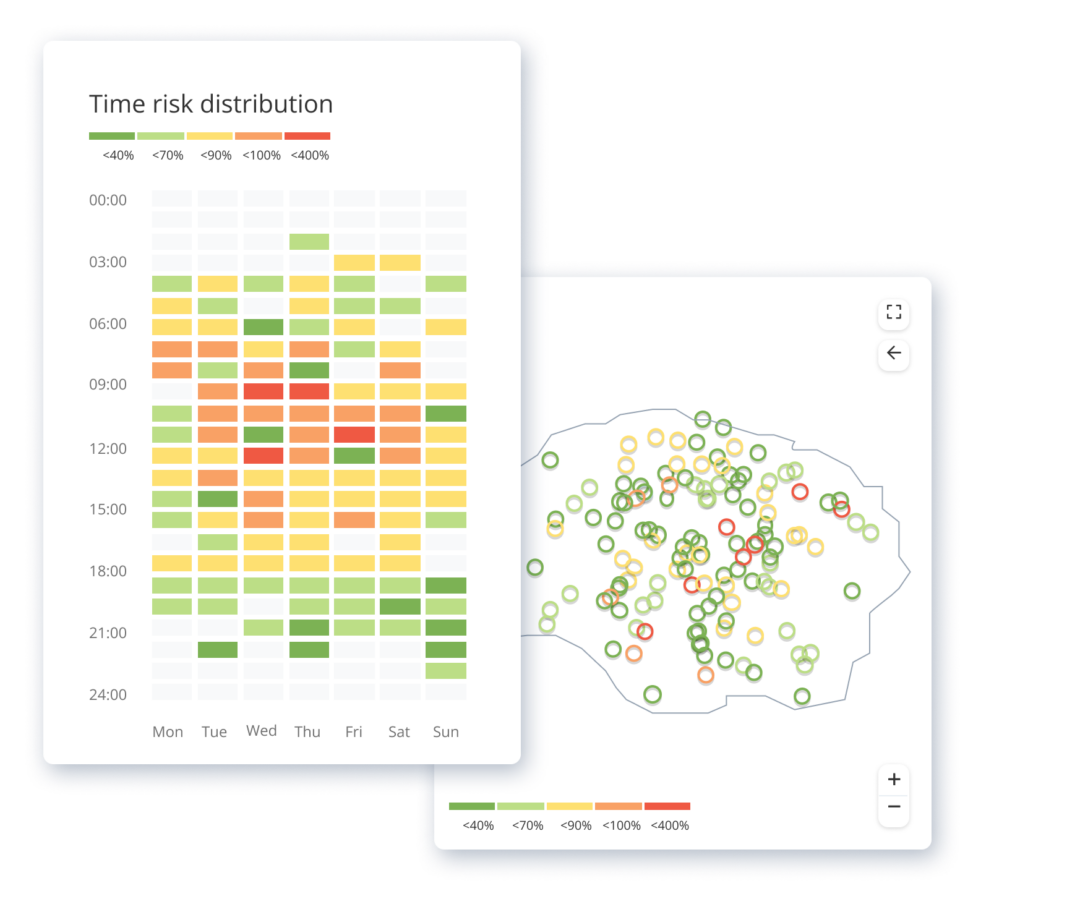
Filter crash probability by time or day for new insights into risk contributors. For example, understand if crash probability is higher at night, at a certain time of day, or on a certain day of the week. Dive deeper to see:
Get in touch for a no obligation walkthrough of how our products can help your business.