


Often, our customers use our risk intelligence to understand more about their organization’s overall risk level, to learn how their current safety programs influence risk, and to identify ways they can further reduce driving risk.
Here, in a series of blog posts, I provide a deep dive into how your organization can use AI-generated risk intelligence to analyze your existing data and uncover actionable insights that will change the way you manage driving risk.

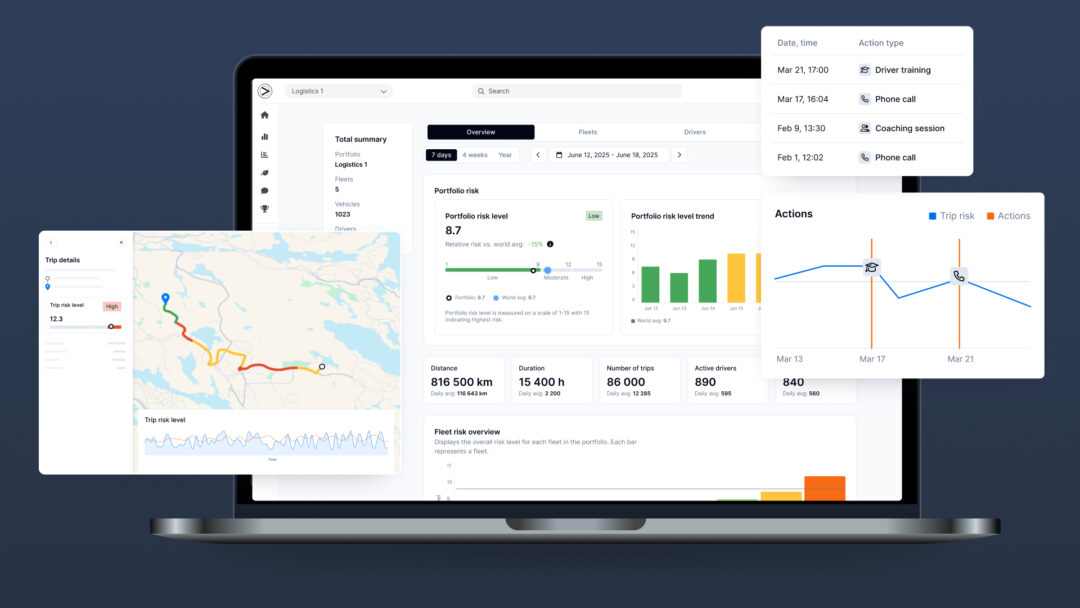
If you already share your driving data with a telematics company, and/ or through your insurance provider, we will use an API connection to access your existing data. Through the magic capabilities of our AI, we will convert the data into a comprehensive overview of risk. And we’ll visualize this for you through our Crash Probability Dashboard.
The Dashboard will enable you to see your overall risk at the company level, right down to individual drivers and trips. The Dashboard’s “Trends” feature provides insights including risk by day of week, time of day, location, and by driver or vehicle.
Key benefit: By using the Dashboard you will gain a new understanding of your total risk and will be able to use the intelligence as a benchmark against which to measure future safety efforts.
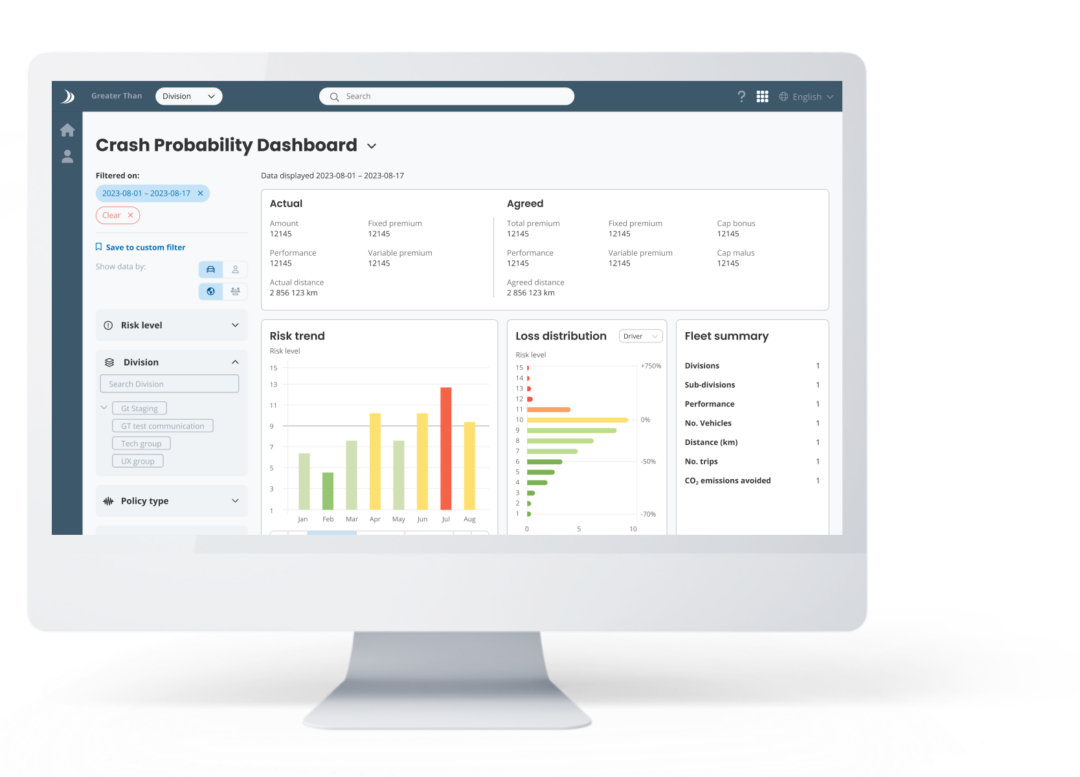
By converting your company’s driving data into Crash Probability Scores, it becomes easy to identify which of your drivers are at highest (and lowest) risk of being involved in a road crash in the coming weeks.
Next, we can conduct an analysis of your company’s actual insurance claims and compare the claims to your company’s average Crash Probability Score.
Check out Part Two of the series to find out what you’ll learn through an analysis of your insurance claims.