


In this series of blog posts, I explain how your company can use our risk intelligence to understand more about your organization’s overall risk level, to learn how your current safety programs influence crash risk, and to identify ways to reduce driving risk further.
If you missed Part One, check it out. Otherwise, read on to discover how our data analysis will help you measure the effectiveness of your company’s existing safety interventions.
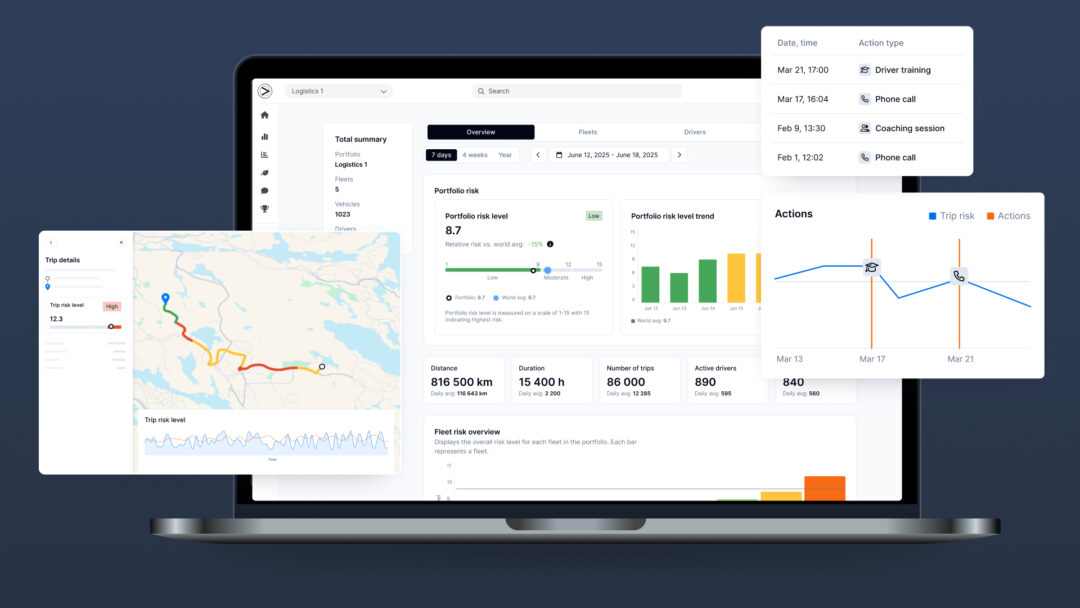
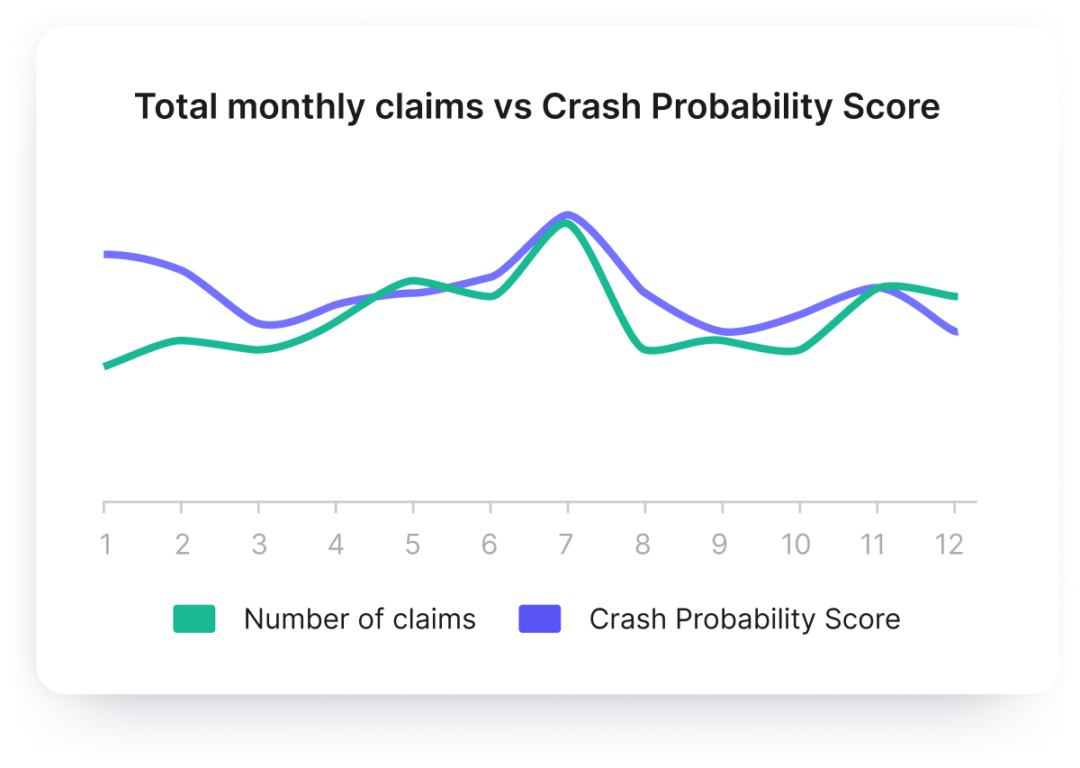
As mentioned in Part One, we will assign a Crash Probability Score to every driver. This will enable you to visualize risk across your entire organization, and at the driver level. We can also conduct a historic claims analysis to provide a clear picture of how the Crash Probability Score aligns with insurance claims. We often identify periods when the overall score is higher, which directly corresponds with a higher number of claims.
But the analysis is also likely to uncover additional insights. For example, during a recent analysis we were able to see that Scores and insurance claims reduced significantly at certain periods throughout the year. Upon speaking with the customer, we discovered that the dips corresponded with company-wide safety interventions.
In this same example, our analysis also identified that the Crash Probability Score and claims increased during December, and the reason for this soon became clear. In advance of the company’s busiest period, a decision was made to reduce the focus on safety.
As a result of our analysis the company was able to see that temporarily halting safety initiatives during busy season had a dramatic effect on crash risk.
Example of insights you might receive:
Key takeaway 1: Measuring the impact of safety initiatives on risk level makes it easy to calculate the ROI.
Key takeaway 2: By benchmarking risk level (1-15), it is easy to set targets for future improvement.
Check out Part Three of the series to find out how our analysis can help your company take a more systemic and effective approach to driver training.