Greater Than and Smart Eye Deepen Collaboration with Predictive Risk Scoring Read press release
Go back
White semi-truck driving on a scenic rural highway surrounded by green fields and trees. An overlay shows a 'Climate Impact Score' of 4 out of 5 leaves, labeled 'Excellent', indicating strong emissions performance.

Hands on emissions reduction

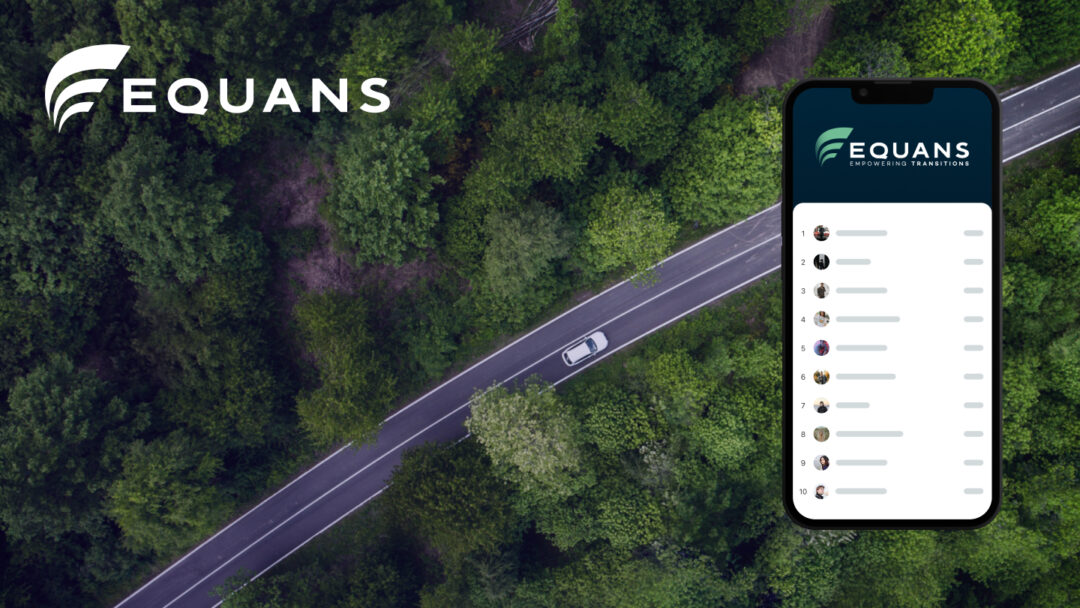
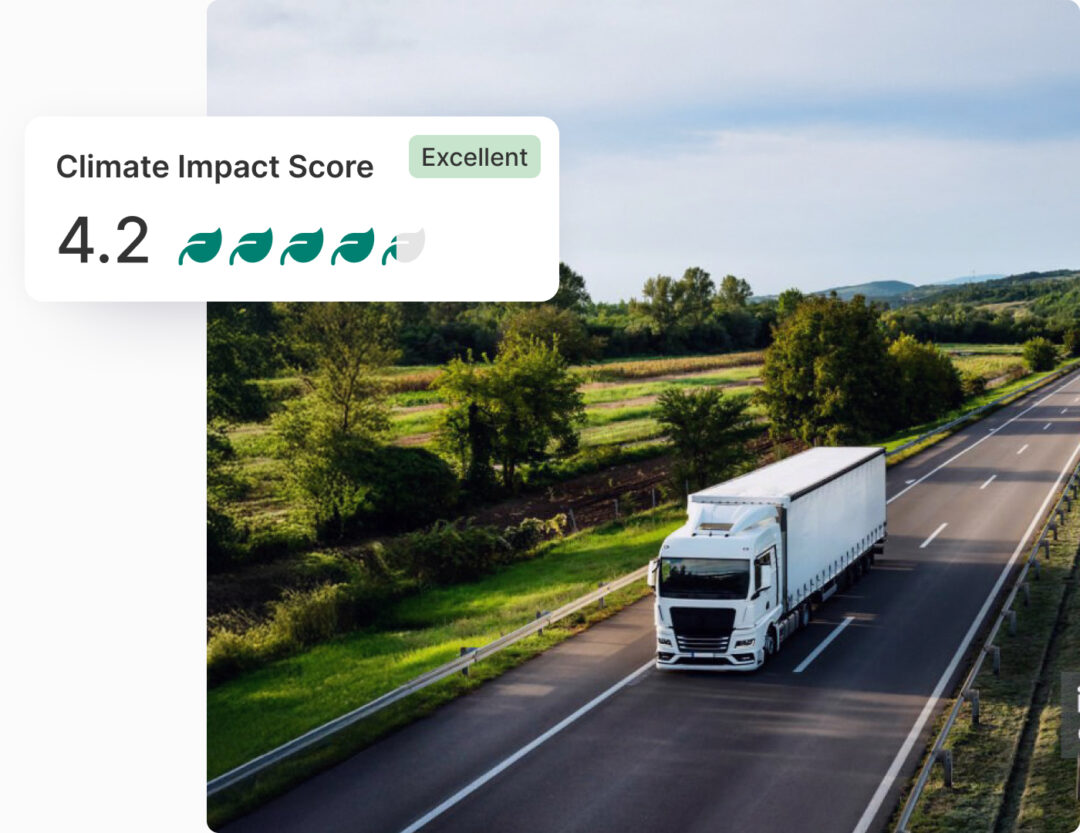
Visualize CO2 emissions across an entire driving population, from overall fleet environmental footprint to individual driver level. Identify drivers with the biggest potential for emissions reduction, benchmark against others, and track ongoing performance.

Dashboard visual showing climate impact data for three drivers—Emma, John, and Michael—alongside their CO₂e reductions ranging from -12 kg to -50 kg. A bar chart illustrates emission trends, and a gauge shows an overall climate impact 19% lower than the average driver.

Get to grips with emissions

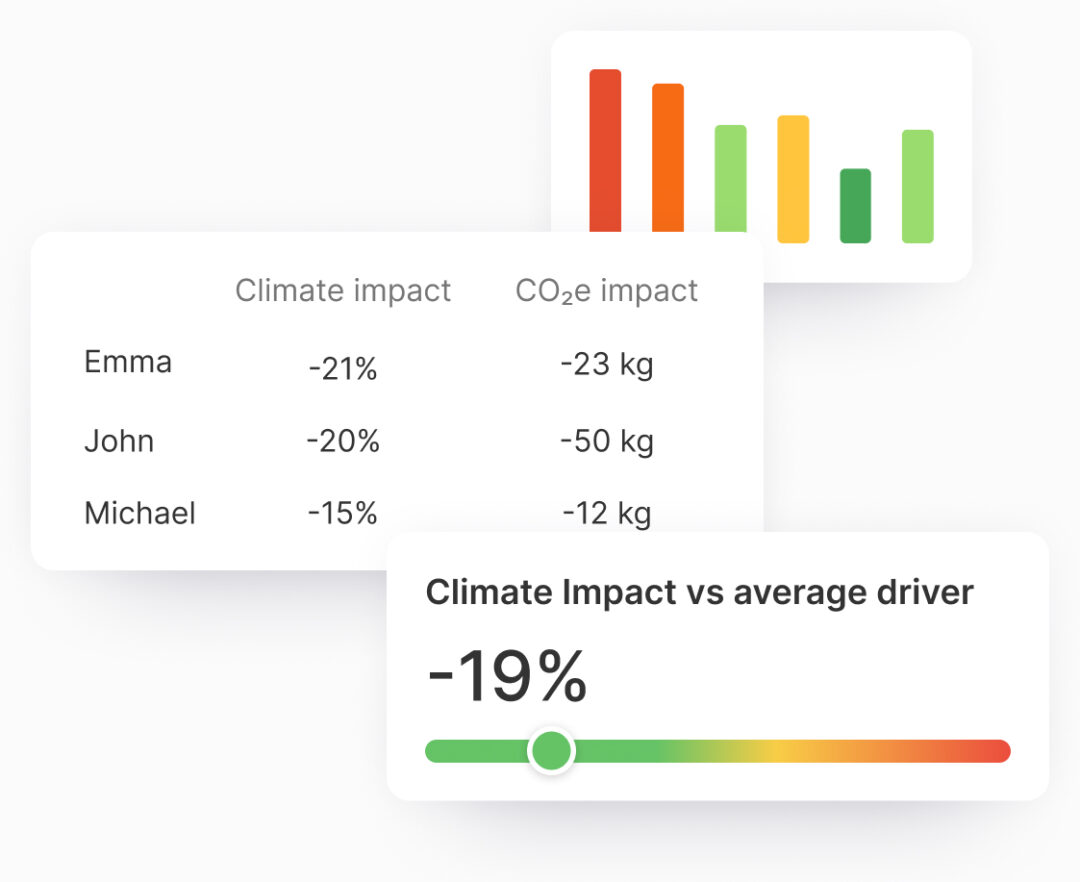
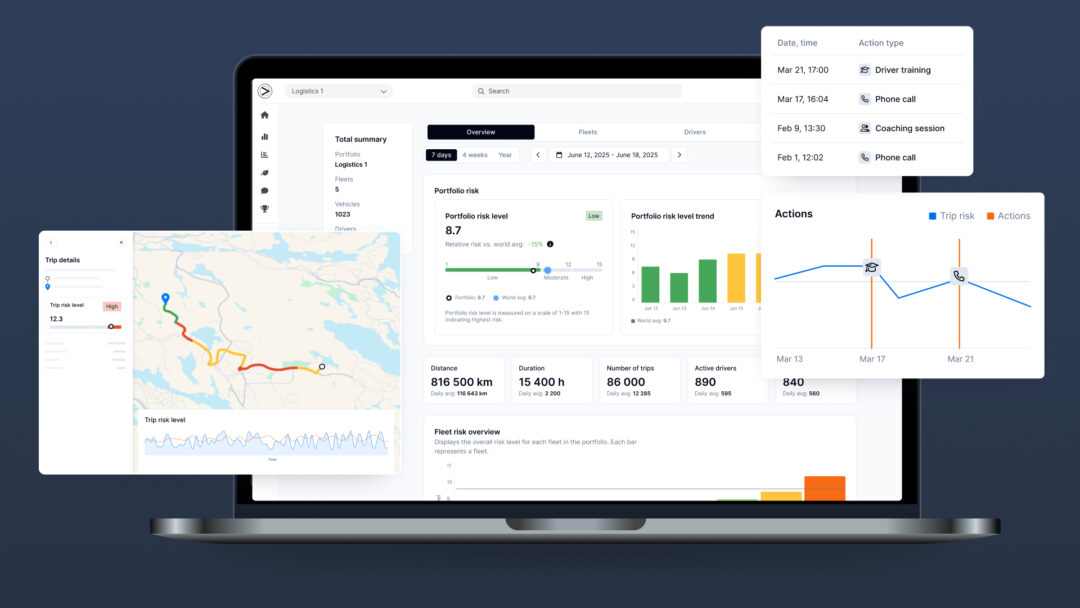
With AI-generated risk intelligence into the driver influence on emissions, you can quickly see where the biggest improvements can be made for emissions reductions. Identify:

  • Driver influence on emissions, regardless of vehicle type
  • By how much % emissions can be reduced
  • Factors influencing driver climate impact
Stylized world map background with two overlaid climate impact scores. One shows a score of 4.2 out of 5 leaves labeled 'Excellent', and the other displays a 3.4 score labeled 'Good', representing environmental performance ratings on a global scale.

Measure, manage, act

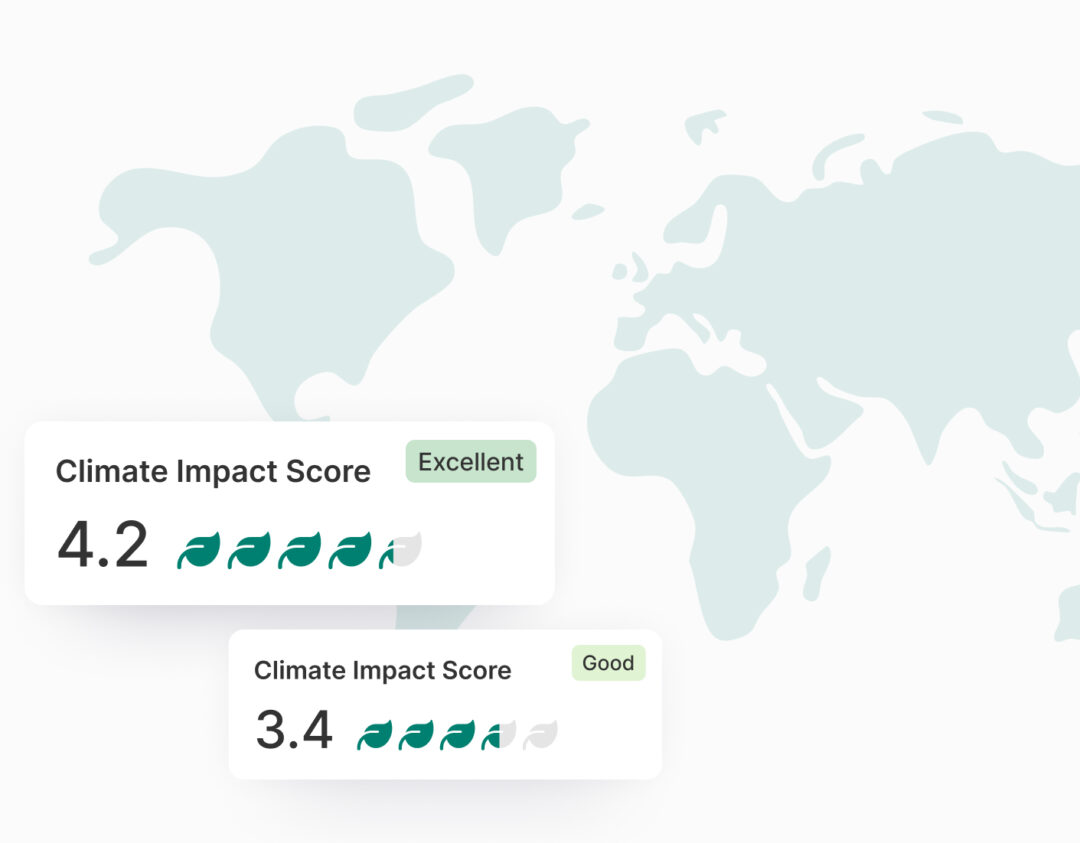
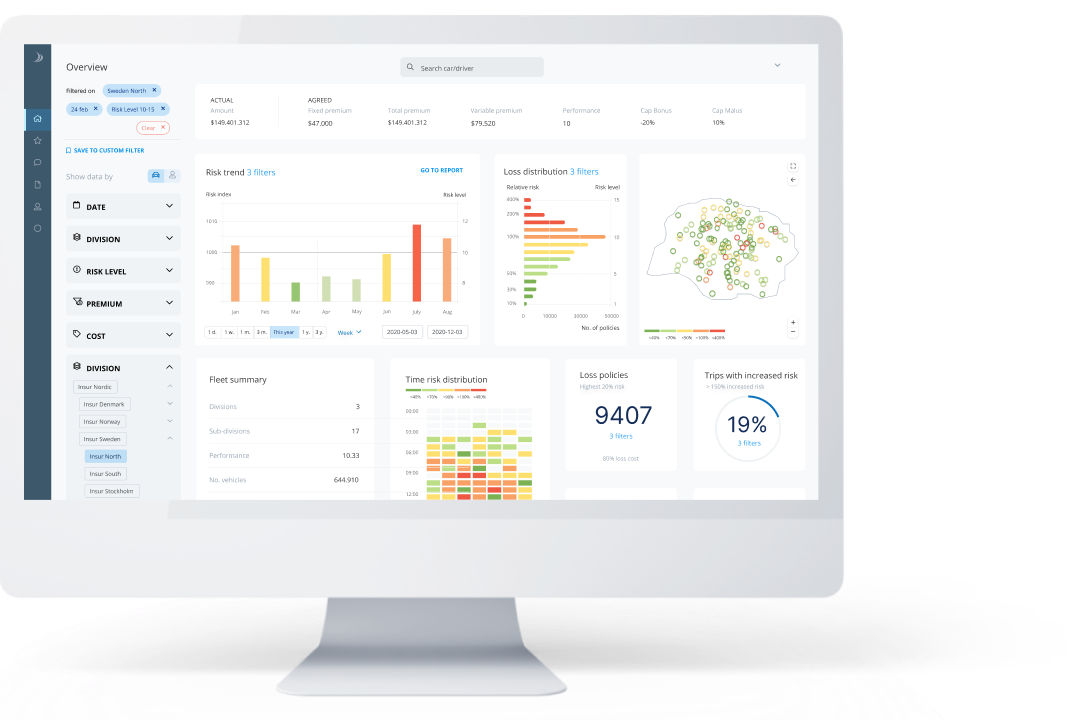
Track your organization’s overall climate impact performance with aggregated data at various levels including vehicle, driver, day of week, time of day and location. Use this to:

  • Benchmark against country and world averages
  • Identify drivers to act on soonest, and what action to take
  • Act and monitor ongoing progress

Products to suit your needs

Real-time insights to quantify climate impact.

Visual overview of driver climate impact and trends.

Book a demo

Get in touch for a no obligation walkthrough of how our products can help your business.

A dashboard showing crash probability stats on mobility

Fill in the form to request a demo