Greater Than and Smart Eye Deepen Collaboration with Predictive Risk Scoring Read press release
Go back
Aerial view of a congested urban roundabout with numerous cars, vans, and a truck navigating through traffic. Overlaid is a colorful bar chart labeled 'Trend', indicating varying performance or risk levels with a gradual decline in bar heights from left to right.

Monitor risk trends

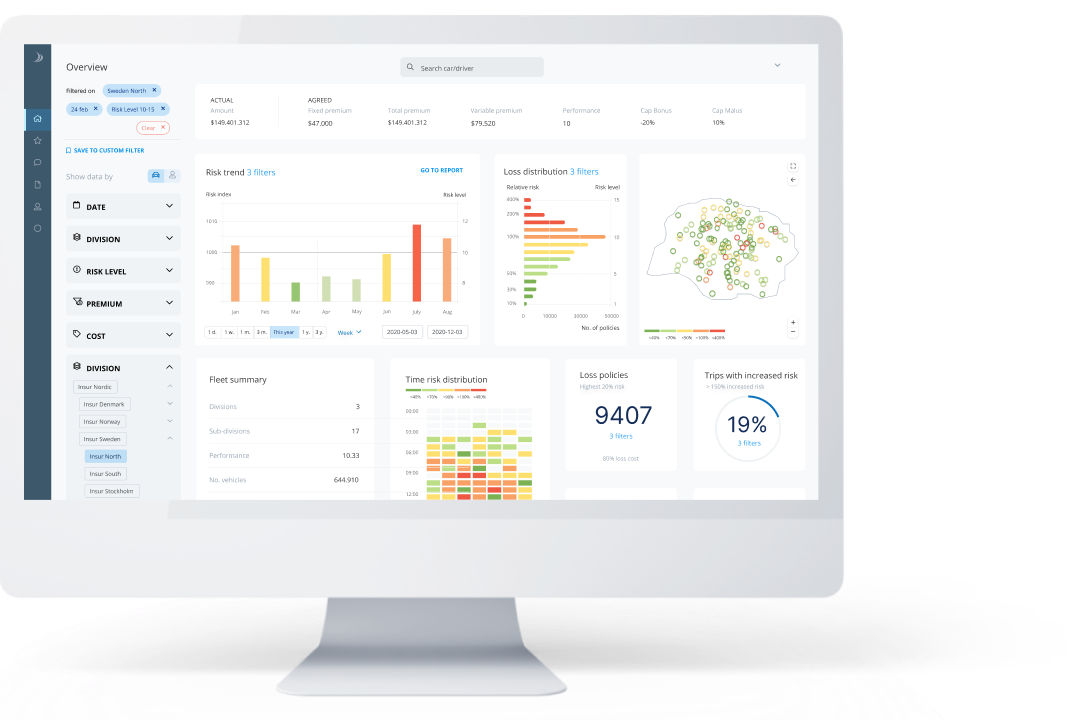
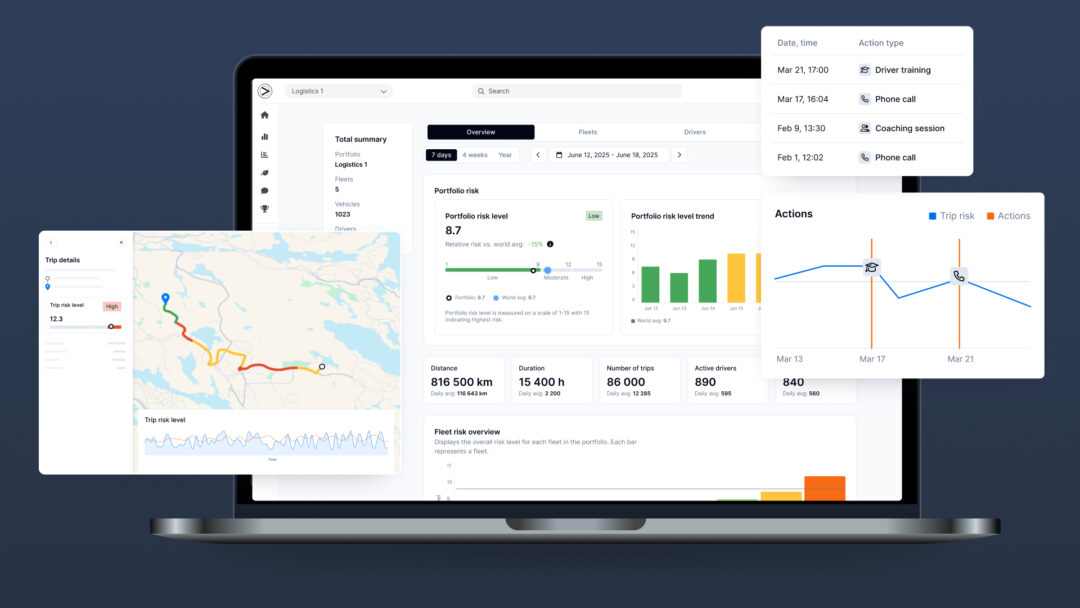
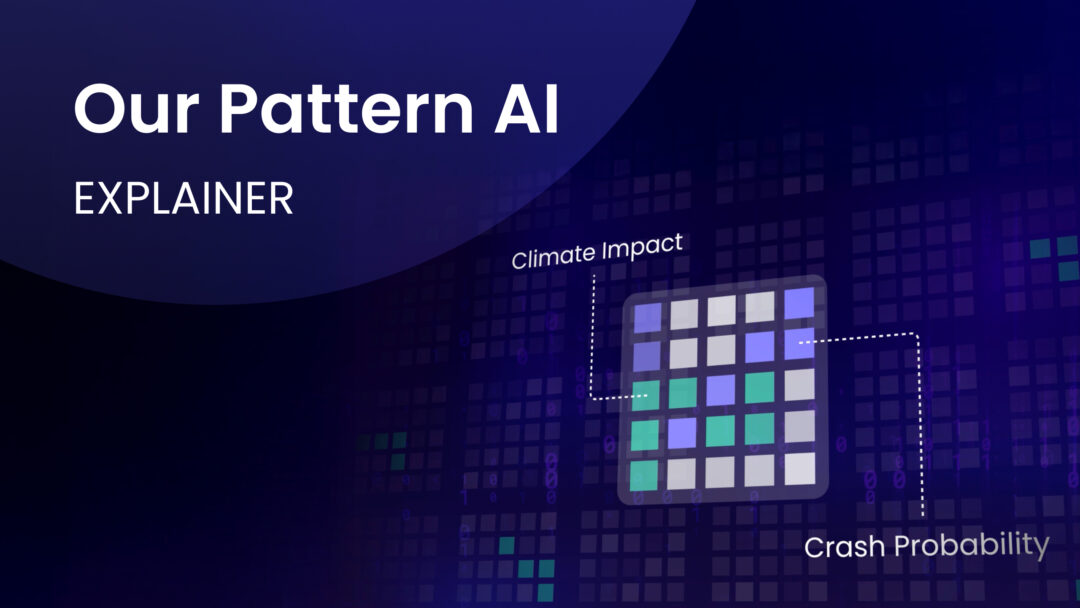
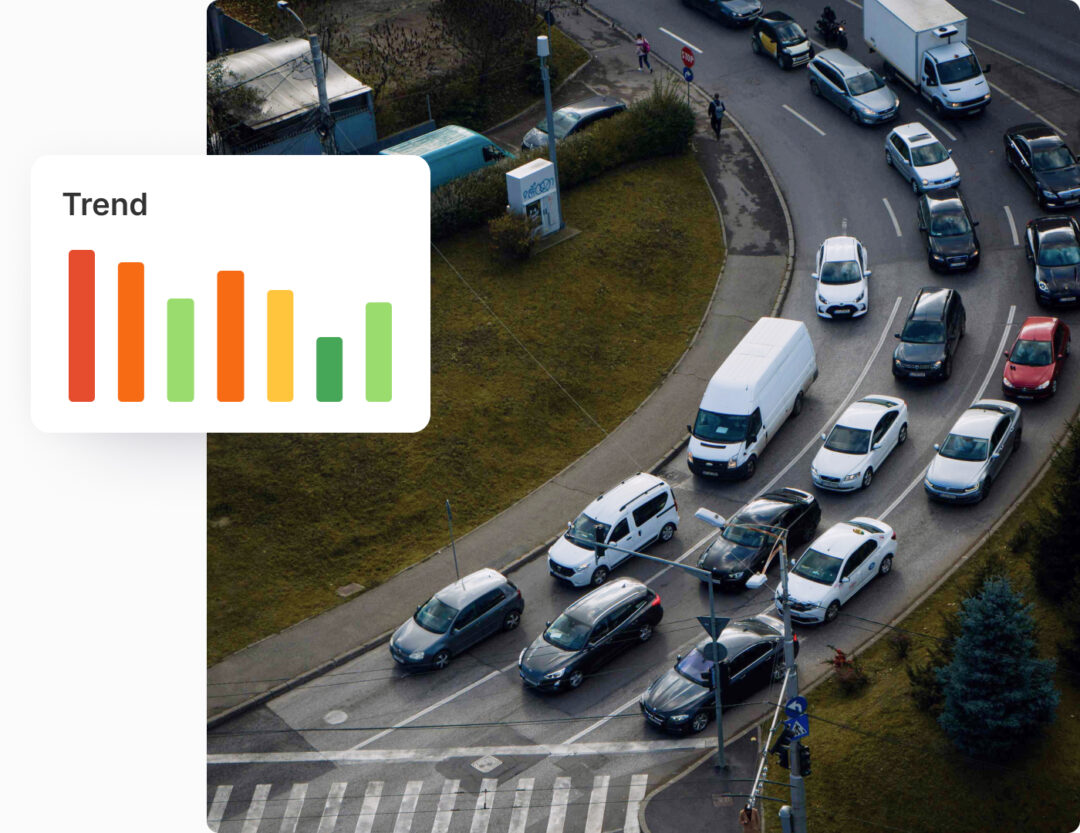
Keep on top of trends in risk performance to evaluate whether driver risk is trending in the right way. With AI-powered risk intelligence you can identify contributory factors to high and low risk, including time of day and geographical location.

Visualization of driving risk data featuring a heatmap titled 'Time risk distribution' showing risk levels by time of day and weekday using color-coded cells from green to red. Overlaid is a map of Northern Europe with clustered data points, each circled and numbered, indicating aggregated regional risk insights.

Aggregated data for risk insights

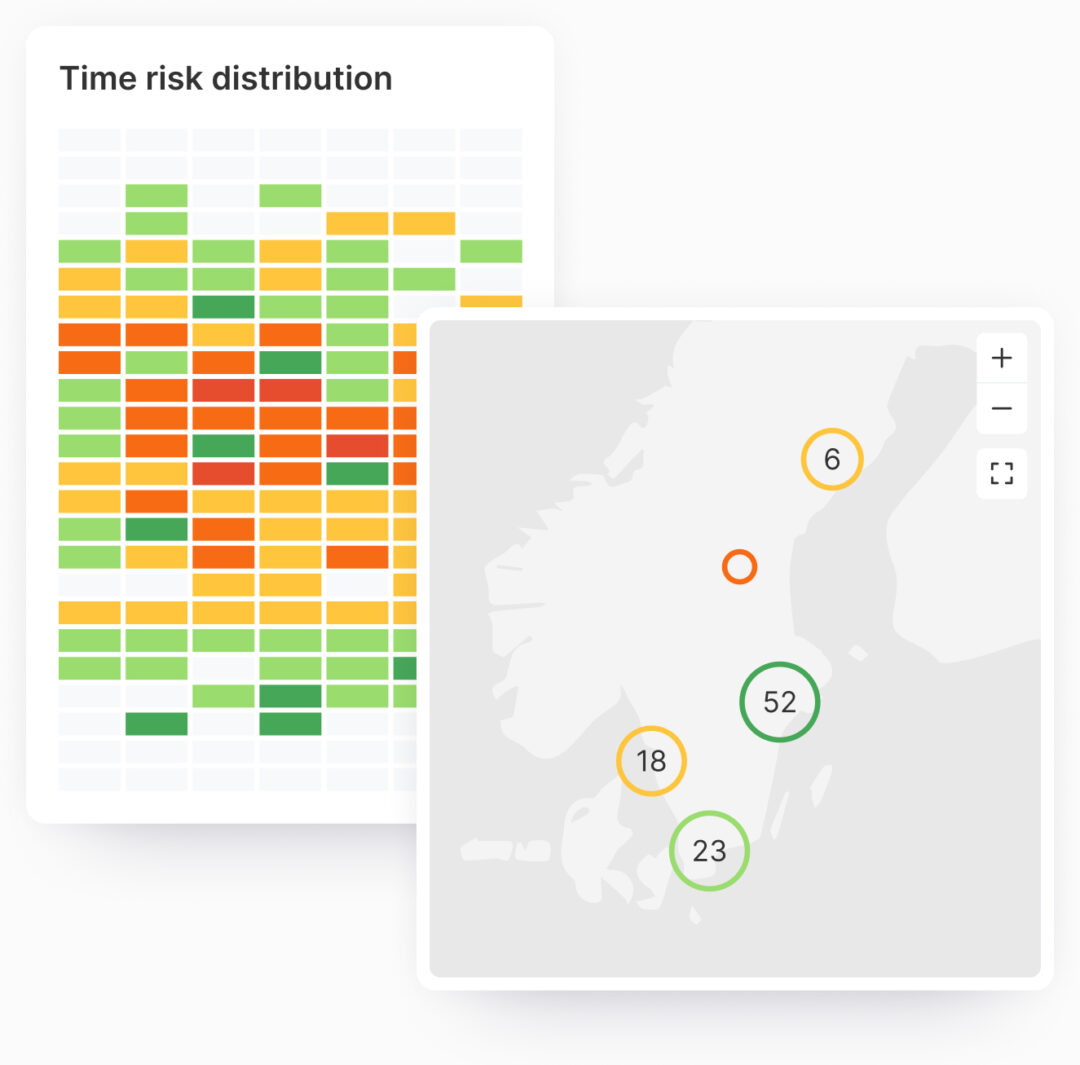
Your existing driving data is aggregated and summarized across multiple categories, making it easy to view trends in risk performance for optimal decision making. View risk by:

  • Time of day or day of week
  • Geography, via heatmaps and trip overviews
  • Vehicle type
Fleet risk evaluation interface showing a calendar view for May 2025, individual driver risk levels labeled as 'High risk' for Emma and 'Low risk' for James, and a Fleet Crash Probability Score gauge displaying a score of 6 out of 15.

Evaluate risk progress

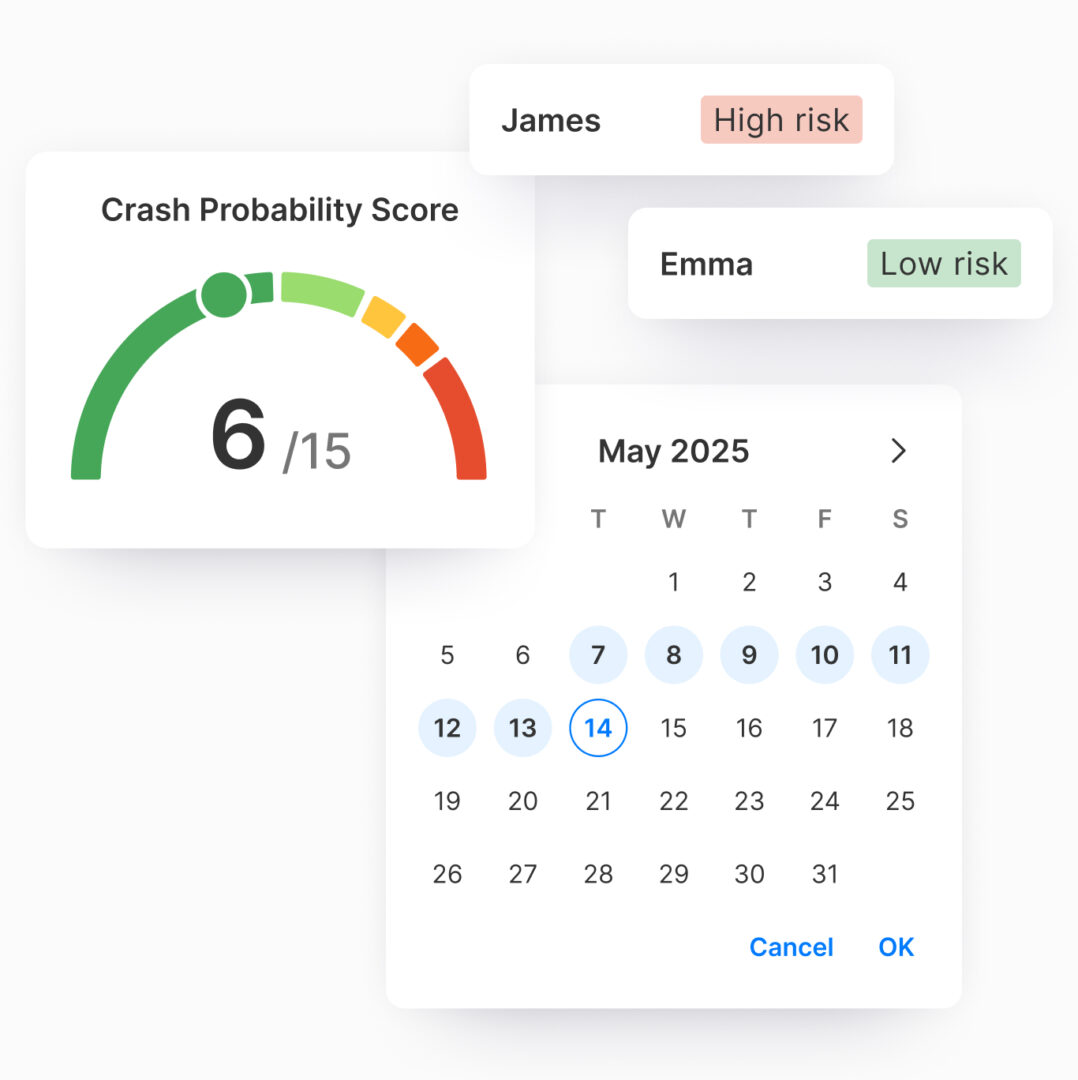
At a portfolio, fleet, or driver level, you can keep track of how risk performance is progressing and understand the reasons behind current risk level. See:

  • Fleet or driver scores
  • Performance vs previous week, month, year
  • Overview of contributory factors

Products to suit your needs

Predictive, data-driven insights into driving risk.

Hands-on tool to predict crash probability and take action.

Book a demo

Get in touch for a no obligation walkthrough of how our products can help your business.

A dashboard showing crash probability stats on mobility

Fill in the form to request a demo