


It has now been more than 20 years since we first started training our Artificial Intelligence (AI) technology.
In a separate blog post, Sten Forseke explains how discussions between the two of us about traditional ways to measure driver risk led to the birth of the AI. Here, I provide a little more detail about the pattern profiling technique that makes our AI globally unique.
Born in 2004, our AI takes a different approach to measuring driver risk and climate impact than anything else on the market. After Sten initially questioned the correlation between the traditional “events based” telematics model and actual crash likelihood and climate impact, I started to investigate this on a deeper level.
As an inventor, problem solver, and business developer, I studied the model and eventually concluded that there was no significant link between driving events, crash risk, and fuel consumption. This led to the birth of our pattern-based AI.
No one spoke about “AI” at the time, but using an early form of AI known as FASILL (fuzzy logic), I started to develop a self-learning model using data from real-world trips and their outcomes. Initially, my focus was on fuel consumption, but it wasn’t long after that we were able to predict driver risk. Over time, working with some early clients, Sten and I were able to verify the predictions and set the technology live. Discover how it all began.
Fast-forward 20+ years later, and our AI is used on a global scale to help companies working within road transportation – such as insurance, telematics, fleet management and mobility – to measure and mitigate crash probability and climate impact. I’m still involved with the AI on a daily basis, working hands-on with our data analytics and tech teams to ensure we deliver the greatest value possible to our customers.
Within traditional telematics environments, driver risk is measured using “events” like harsh braking, harsh acceleration or speeding. And, often, climate impact – if measured at all – is estimated using distance driven and speed.
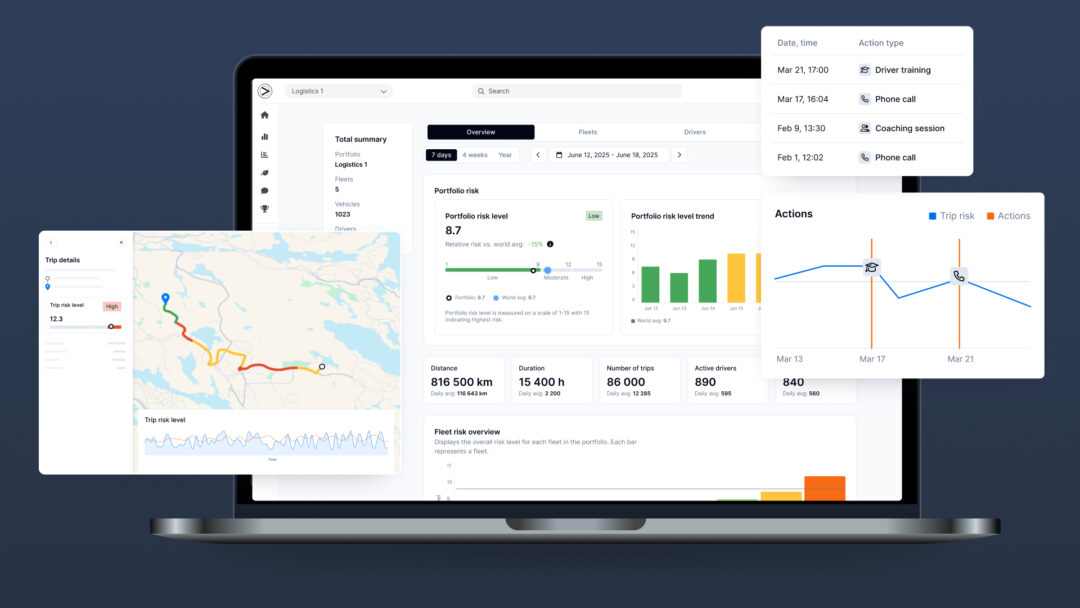
Our AI is very different. We look at real-world trips and their outcomes, whether they involved a crash or not, and their fuel consumption. We then analyze a driver’s movements through an ENTIRE trip – not just events – to identify driving patterns, which we can compare against existing trips in our database to look for similarities. This is pattern profiling. And it’s this that makes it possible for us to predict risk, rather than react to it. We currently have over 7 billion driving patterns in our database, trained with data from 106 countries and 1,600 cities.
To measure something correctly you need to be able to benchmark it. And our extensive AI training means we have built up very solid benchmarks that enable us to identify the “average” driver. That is, a driver who has average crash probability and average climate impact.
From this, we’re able to predict which drivers have a higher or lower than average likelihood of being involved in a crash – as well as how much higher or lower. Also, whether the driver has higher or lower climate impact than the average driver.
Added to this is the ability to predict when something is likely to happen. Our AI allows us to quite literally “see the future” so we can predict outcomes and give enough time for our customers to act on the information.
We often say that our pattern profiling works in a similar way to facial recognition technology. But, instead of comparing faces against a database to look for matches, our AI compares very small actions and movements throughout a driving trip to look for matches in previous trips.
The AI is also constantly looking ahead; this means it continually compares what’s happening during a trip to determine what the outcome will be. And this prediction is dynamic, so it is always re-calculating the outcome dependent on the actions of the driver.
Yes, we can compare pattern profiling to building toy block structures! Let’s imagine we have 100 people around a table and we give each of them 300 random toy block pieces. Now, let’s imagine we already have data on what 7 billion other people built using 300 toy block pieces. As the 100 people start to build their structures, we can predict what the outcomes will be, because we know the outcomes of 7 billion previous builds.
The more pieces each person uses, the more accurately we can predict each outcome. And, most interestingly, depending on which pieces each person starts with, we’re more likely to predict the type of structure they will create. So, for example, someone who starts with wheels is highly likely to build a vehicle of some kind.
Our AI works in a similar way. Because we analyze a driver’s entire trip, not just events, we can rapidly start to predict the outcome based on previous real-world trips, and we don’t need much data to get started! In fact, we only need 1km of driving data to start accurately predicting the outcome of the trip.
Let’s imagine that 100 people are aiming at a target in archery and every person gets 100 shots at their target. After just a few shots, the “patterns” on the target boards would begin to show the people with an accurate aim. After 100 shots, the patterns would be much clearer. And, while most people would have achieved some hits around the center, many would have shots distributed in a particular way, such as a cluster to the right, or to the left. Or maybe even shots completely off the board.
From each person’s “pattern” it would be possible to identify the areas in which they needed more guidance – such as help with posture, stance, grip, relaxation, etc.
Again, this is similar to how the AI works. By identifying patterns in driving behavior, the AI can pinpoint contributory factors to crash probability and climate impact, helping organizations to determine what action to take to reduce negative driver impact.
Our AI is based on outcomes we know have happened, and by training it extensively over the last 20+ years and working with companies globally, we’ve been able to see how effective it is at predicting driver risk and climate impact.
We continue to train the AI with data coming in all the time. And, although the core of the model isn’t influenced much by new data, our capabilities in predicting type and severity of crash are constantly evolving. In fact, our AI is particularly effective at predicting serious and severe crashes – and it’s preventing these types of crashes that has the most potential to improve road safety.
Because of our pattern profiling technique, our AI also sees risk building, helping organizations to act on risk sooner, preventing crashes before they happen.