


AI Coach
The AI Coach delivers contextual, behavior-based feedback based on each driver’s unique risk profile. It empowers risk managers with automated insights uncovered through AI-driven pattern recognition: enhancing safety interventions, reducing workload, and saving time.
Your AI safety partner
Communicating with drivers about their performance no longer needs to be a guessing game. The AI Coach strengthens driver engagement with timely, actionable insights that make feedback more relevant and effective.
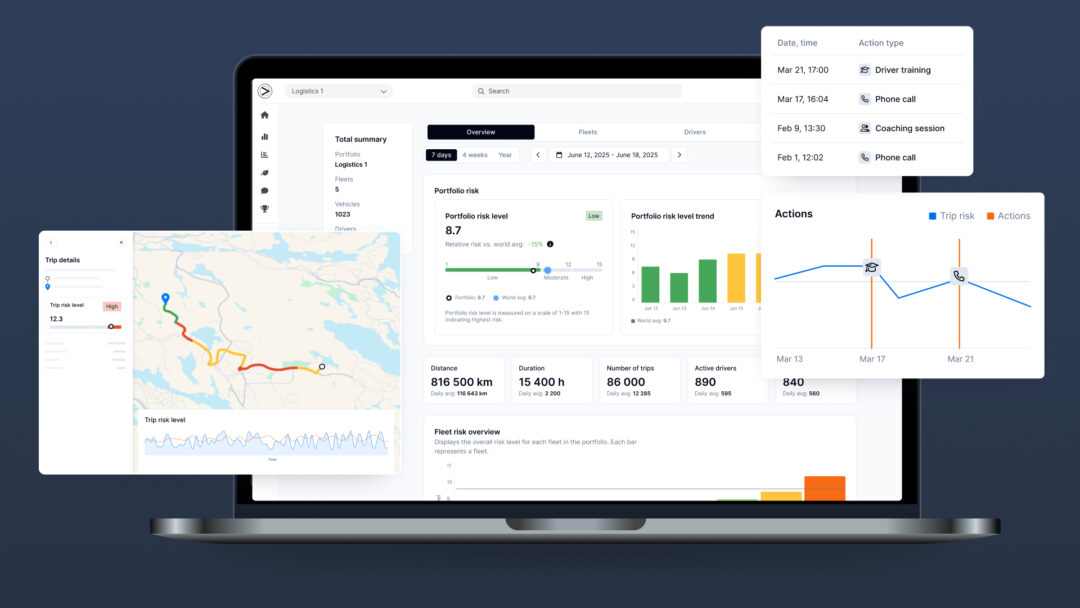
- Provides contextual feedback at the right moment: after each trip, daily, weekly, or monthly
- Suggests clear, effective messaging to reduce risk or reinforce safe driving habits
- Seamlessly integrates into driver-facing apps to deliver insights directly to drivers
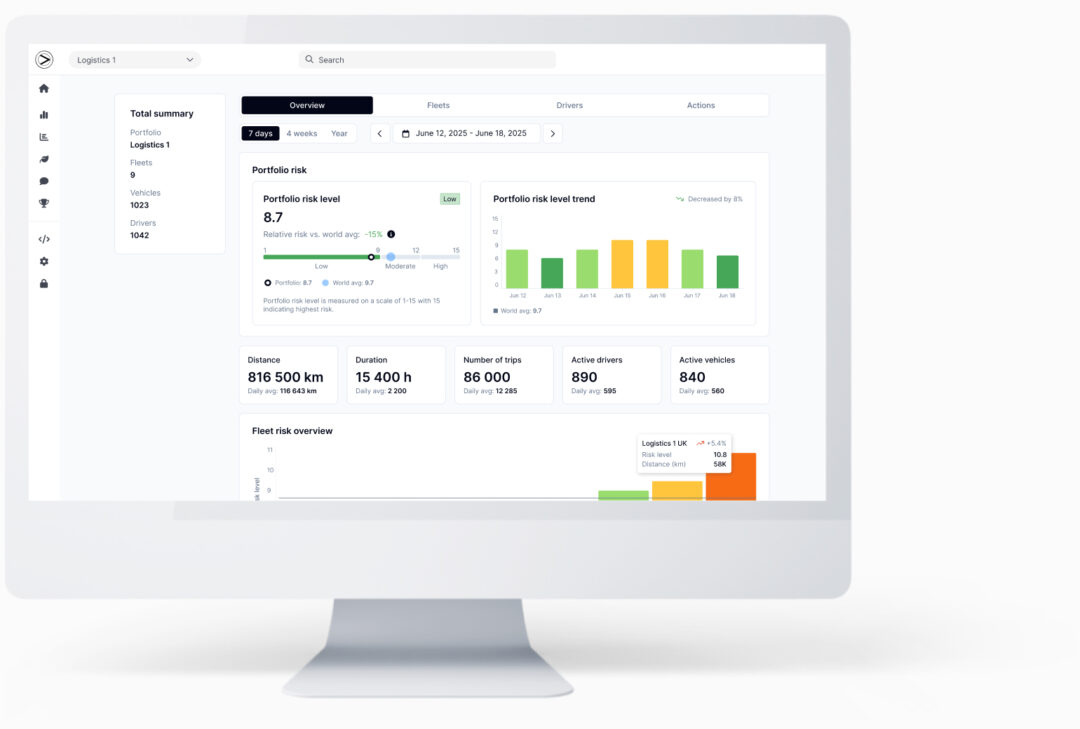
Data-driven insights
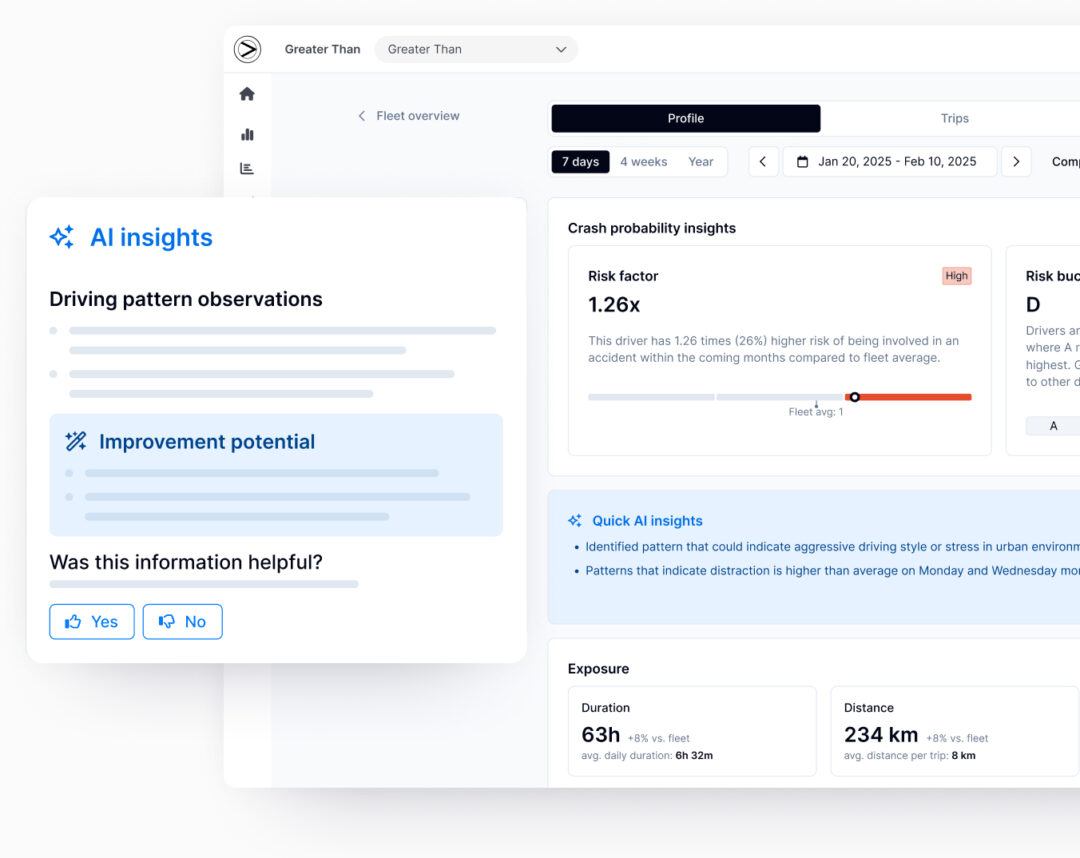
Greater Than’s AI is not rule-based; instead, it continuously analyzes GPS driving data through entire trips, enabling the AI Coach to:
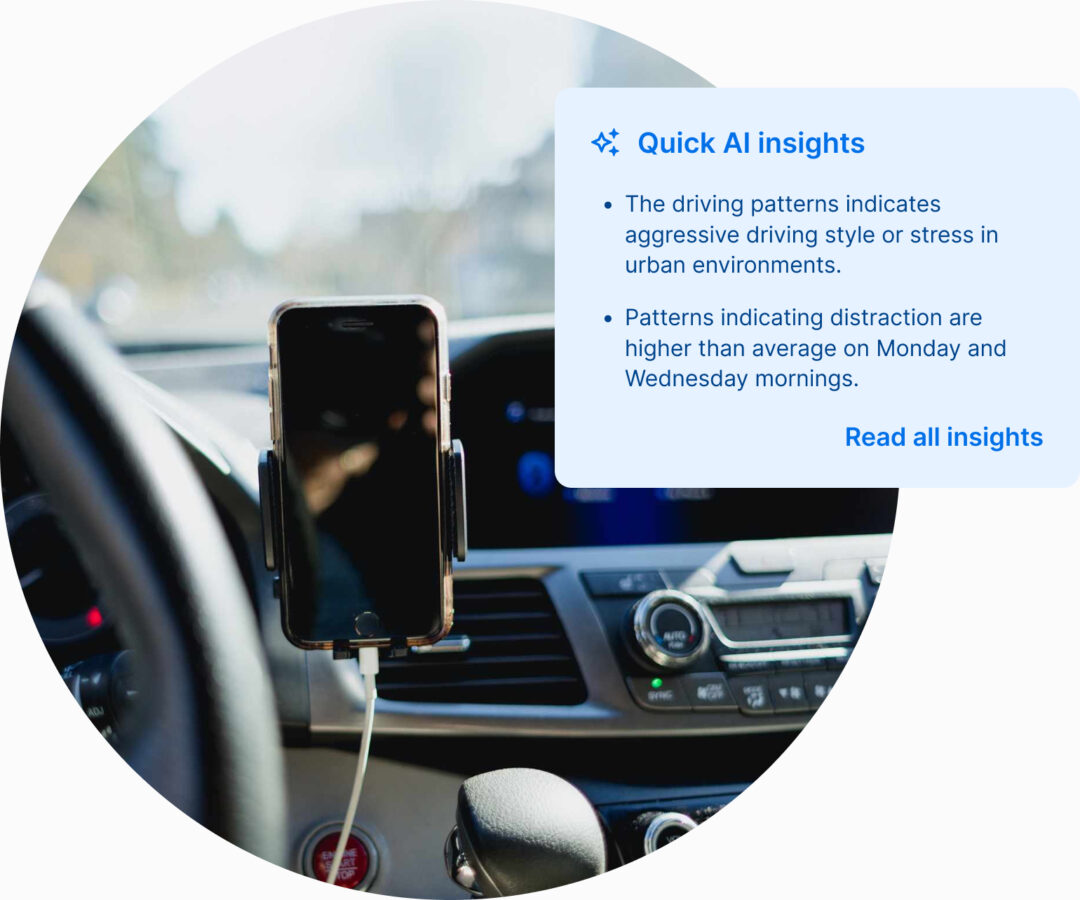
- Detect subtle, often-overlooked behaviors
- Predict why a crash might occur
- Provide personalized recommendations for each driver
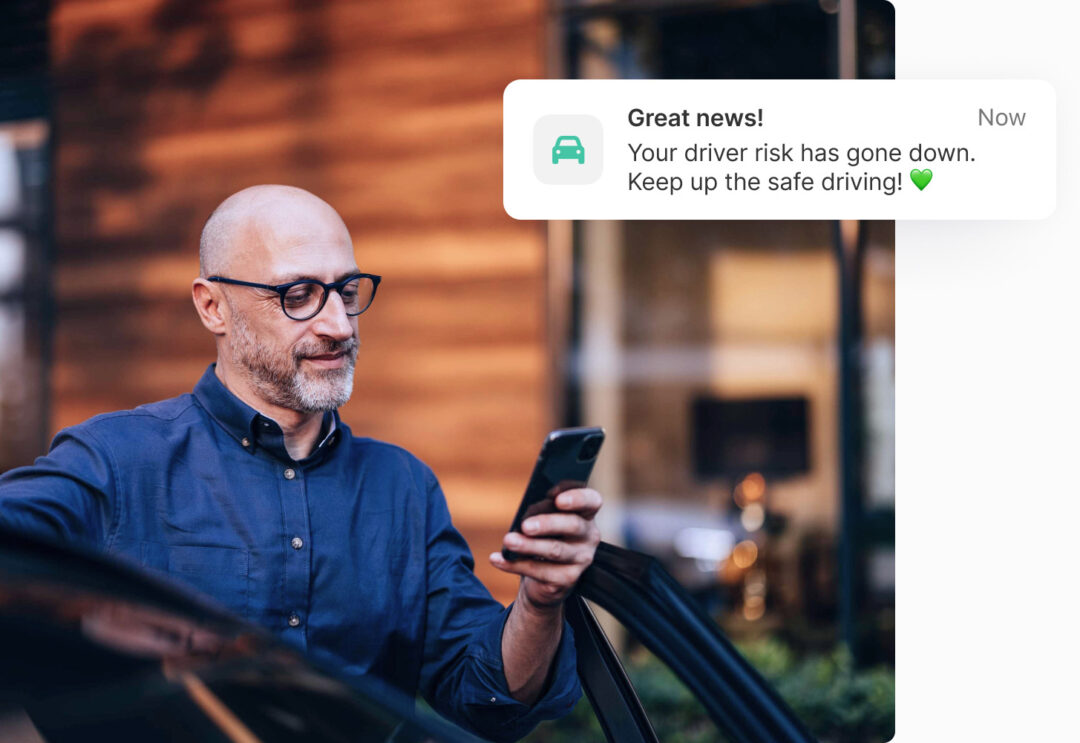
Motivational feedback
The AI Coach uses advanced AI pattern profiling to identify driving behaviors across the entire risk spectrum. By highlighting both positive and negative driving behaviors it:
- Engages and motivates drivers
- Reinforces good habits
- Encourages a proactive safety mindset
Book a demo
Get in touch for a no obligation walkthrough of how our products can help your business.