
戻る
自然の中の道路を走る車

Report on safety and sustainability with existing driving data

Get crash probability and climate impact insights to track progress, act, and report with confidence.
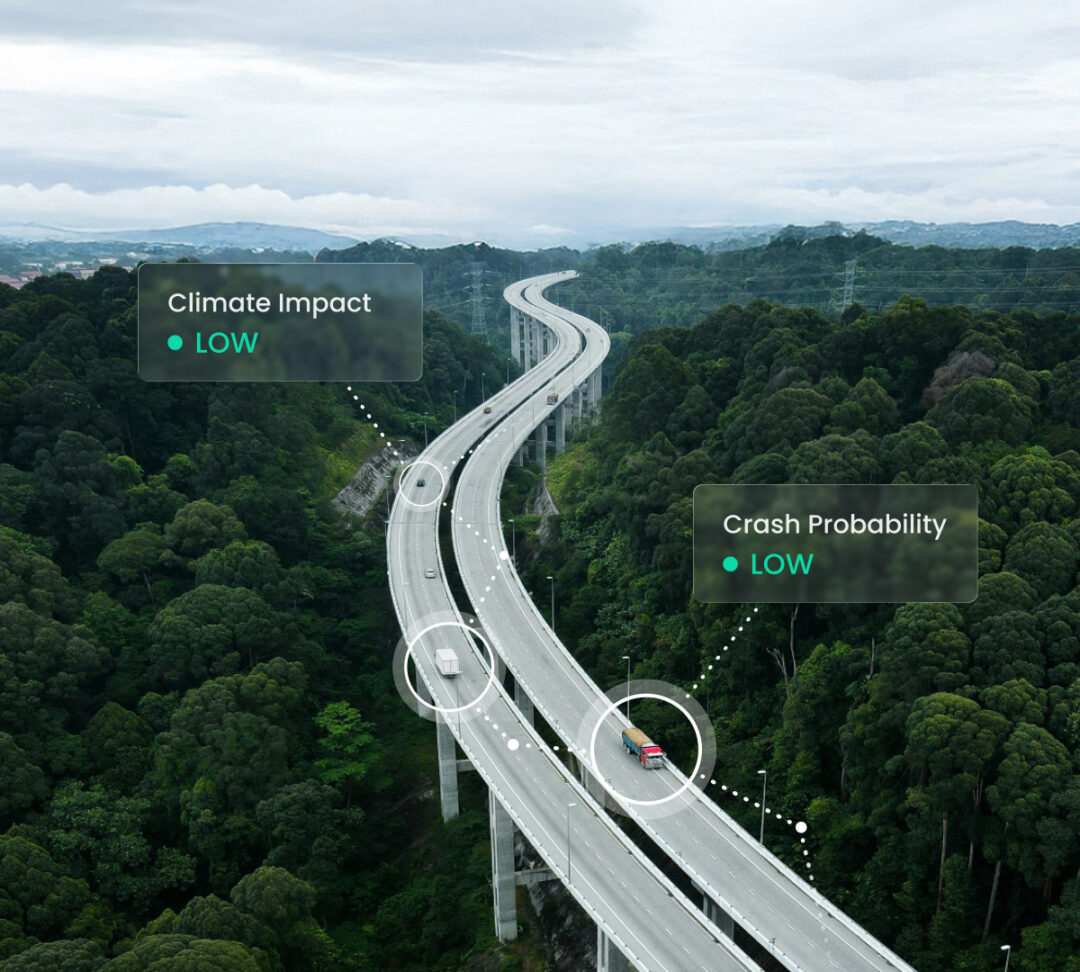
Aerial view of a highway bridge cutting through a lush forest, with AI-powered telematics technology highlighting vehicle positions to visualize traffic and driving behavior insights.

One data source, two ESG metrics

Environmental, Social and Governance (ESG) reporting does not only refer to sustainability performance; it’s about road safety too. Our AI measures the driver influence on both climate impact and crash probability, making it easy to get the data you need from a single source.  
  • Quantify driver influence on climate impact
  • Measure crash probability alongside it
  • Get consistent, comparable insights from your existing GPS data
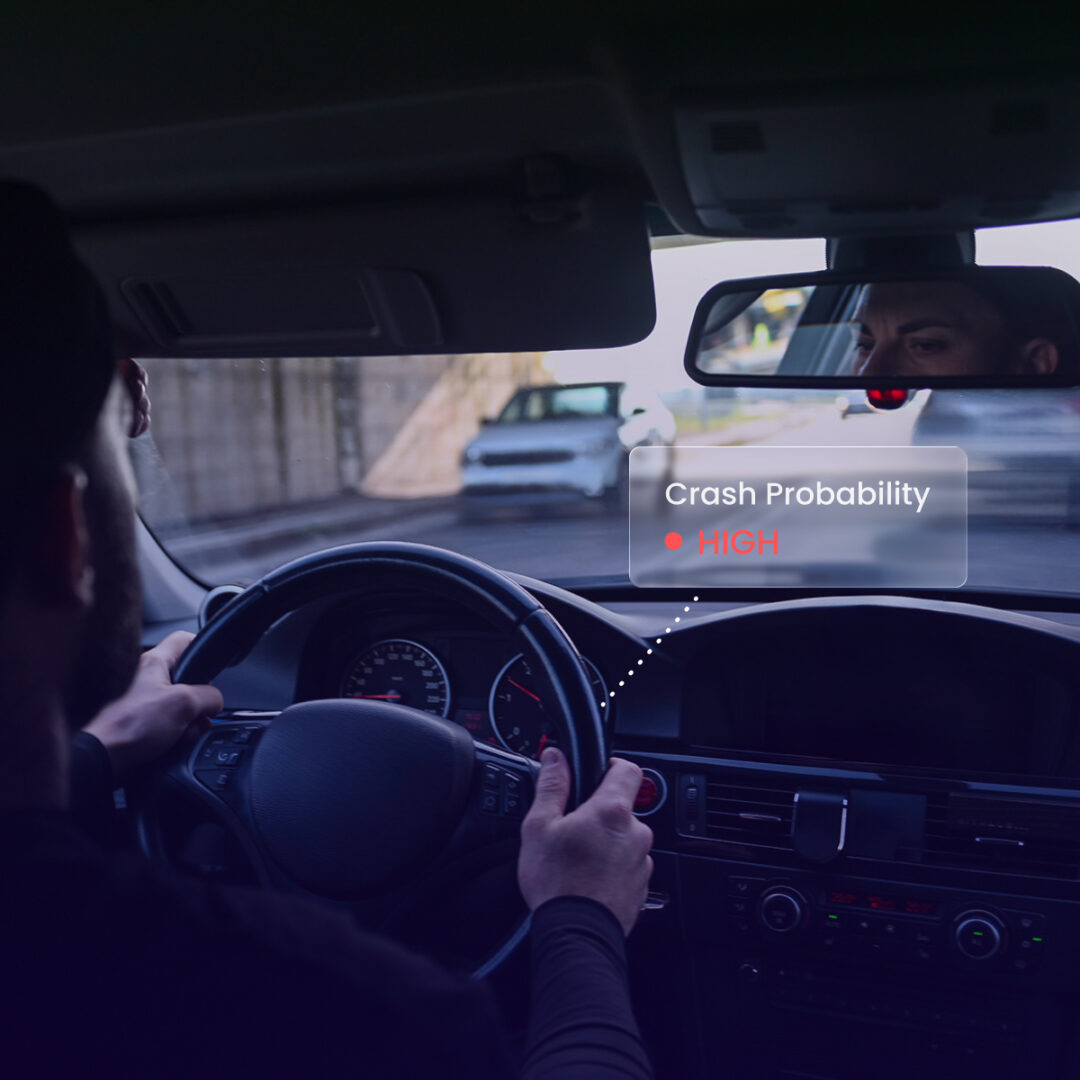
Interior view from behind a driver steering a car, looking through the windshield at oncoming traffic. A transparent digital overlay connects a dotted line from the dashboard to a floating panel that reads,

Look ahead, not just back

The most important crashes to report are the ones that don’t happen. With predictive AI, you can see where crash probability is highest, act to reduce it, and report on what you did to improve safety.  
  • See which drivers are most likely to be involved in a crash, before it happens
  • Understand the driving patterns behind that risk, not just single events
  • Show how you’re acting to prevent crashes, not only how many have occurred

Read about the independent validation of our AI

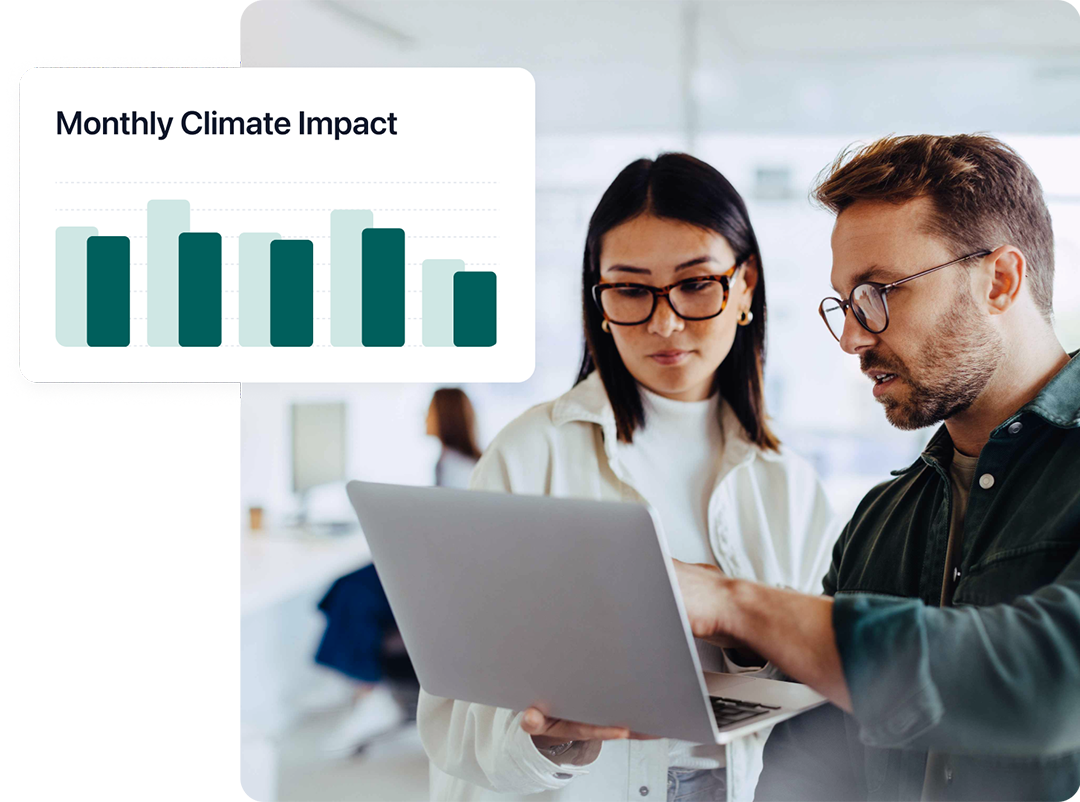
Two professionals reviewing data on a laptop, a bar chart widget above them show Monthly Climate Impact.

Set targets and track progress

Stakeholders expect to see progress – for both safety performance and climate impact. By setting targets and tracking progress you can turn reporting into evidence.  
  • Set improvement targets for safety and sustainability
  • Prioritize the drivers and fleets where the biggest changes are possible
  • Follow progress over time
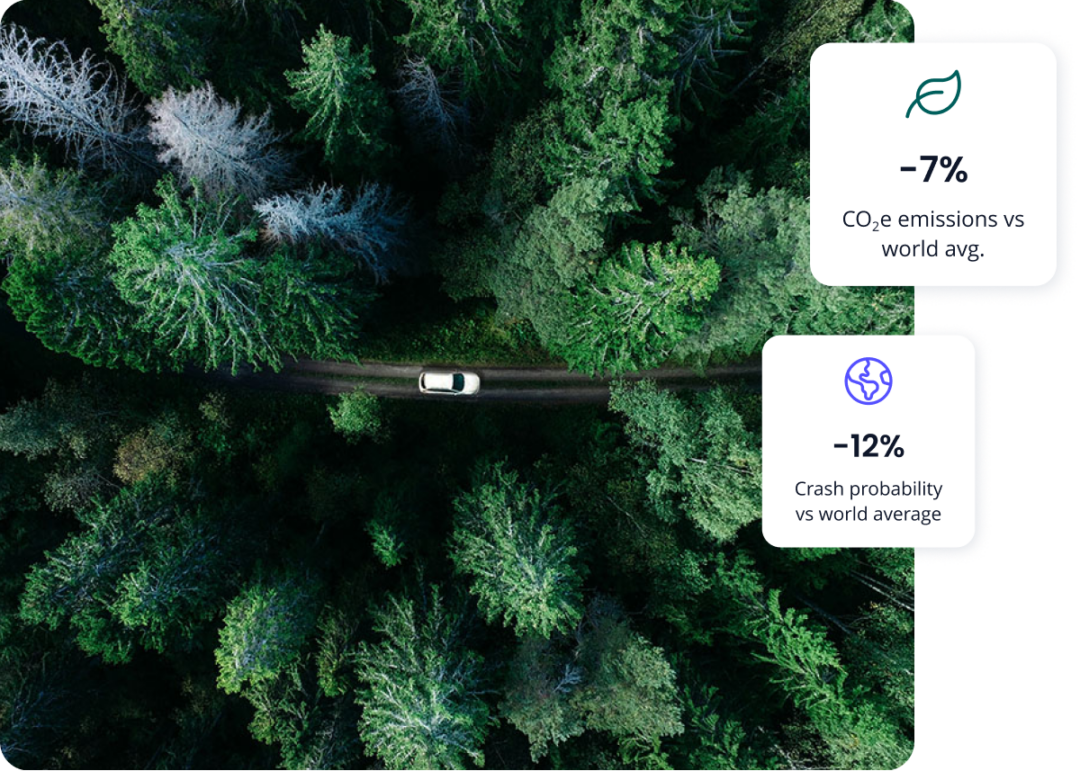
A car driving in the forest with cards showing data on CO2e and Crash Probability

Compare like for like

How much of your environmental and social impact is down to the way your vehicles are driven?  

Because our AI measures driver influence, you can see it for each driver and compare them fairly across your entire organization.  
  • Compare safety and sustainability across vehicle types, fuel types and locations
  • See performance compared with your company, country or world average
  • View crash probability and climate impact from single driver to whole organization
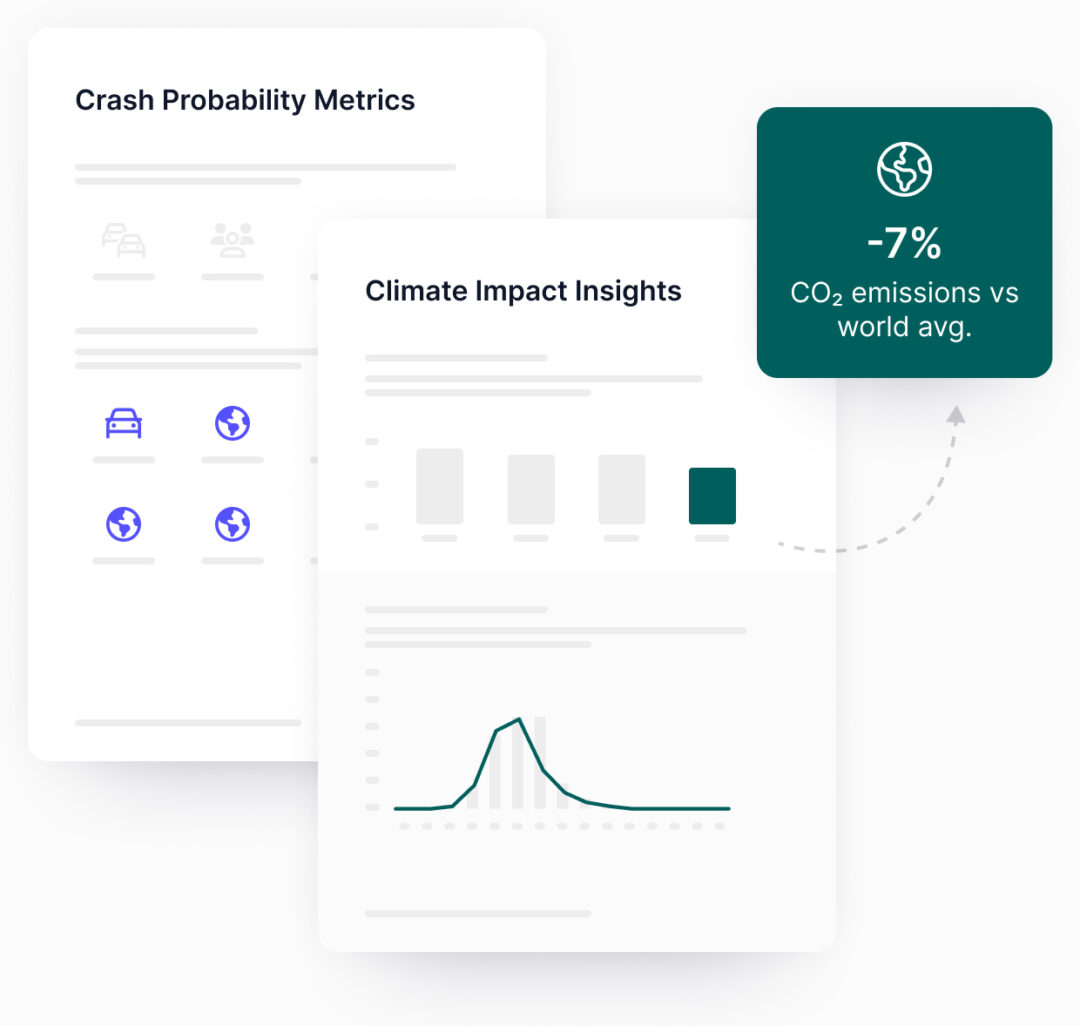
衝突確率の指標」と「気候への影響に関する洞察」と題された2つの様式化されたレポートページには、図解アイコンとグラフが掲載されている。緑のラベルは、環境パフォーマンスの向上を示す「-7% CO₂ emissions vs world avg.

Get ready-to-use reports

The same analysis that gives you safety and sustainability insights is also used to generate ready-made reports on your organization’s performance and progress.  

  • Receive annual reports covering both crash probability and climate impact
  • Use the digital format for compliance and the PDF format to share with customers and stakeholders
  • Support ESG compliance requirements
コードと2つのモジュールのデータを図と数字で可視化した画像

Start today with the data you already have

All we need is GPS data, shared via API, SDK or smartphone app from your dashcam, connected car, telematics device or other system.

  • データソースを選択
  • We process and analyze it
  • Access new insights and reports

はじめる

お問い合わせ

当社の製品やサービスがお客様のビジネスにどのように役立つかをお調べですか?詳細情報を入力すると、専任の営業チームからご連絡を差し上げます。お客様のニーズをお聞かせいただき、成功に導くお手伝いをさせていただきます。

橋の上を水平線に向かって走る車