Greater Than and Smart Eye Deepen Collaboration with Predictive Risk Scoring Read press release
Go back
Delivery driver wearing a 'Fast Delivery' uniform, viewed through a van window. Overlaid is a radar chart evaluating driving behavior across five categories: Speed control, Focus, Consistency, Planning, and Score, showing a balanced performance profile.

Visualize and control driver risk

Driver risk does not stand still. Visualizing and controling risk therefore requires a dynamic approach. Our risk intelligence predicts road crashes weeks before they happen, empowering you with the knowledge you need to protect and prevent.

Map visualization showing driver distribution by risk category across regions, with color-coded circles indicating driver counts—52 in green (low risk), 23 and 18 in yellow (moderate risk), and 6 in orange (elevated risk). A legend titled 'Risk buckets' classifies drivers into categories A through E by relative risk.

Risk performance at a glance

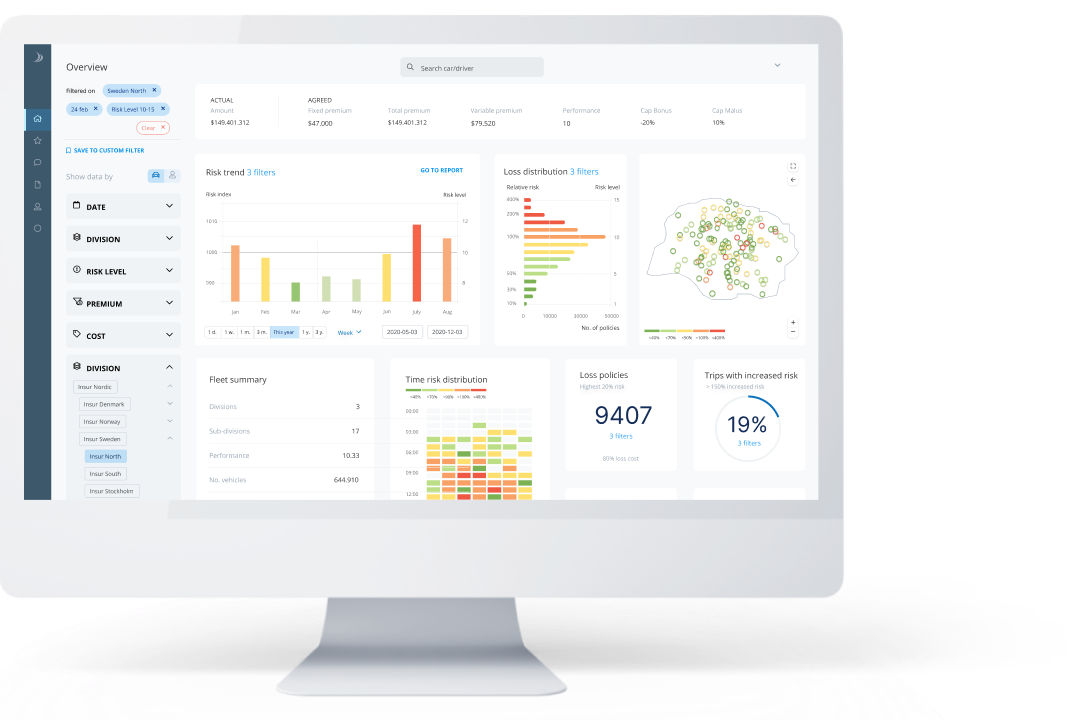
Visualize risk performance across an entire driving population, from fleet summary to individual driver level. See risk scores, trends, risk distribution and view performance compared to benchmarks.

Table showing crash probability scores and performance metrics (focus, anticipation, speed control) for drivers Luke, Sarah, Mike, and Anna, color-coded by risk level. Includes visual indicators of crash probability trends and an overall score gauge.

Take control of risk

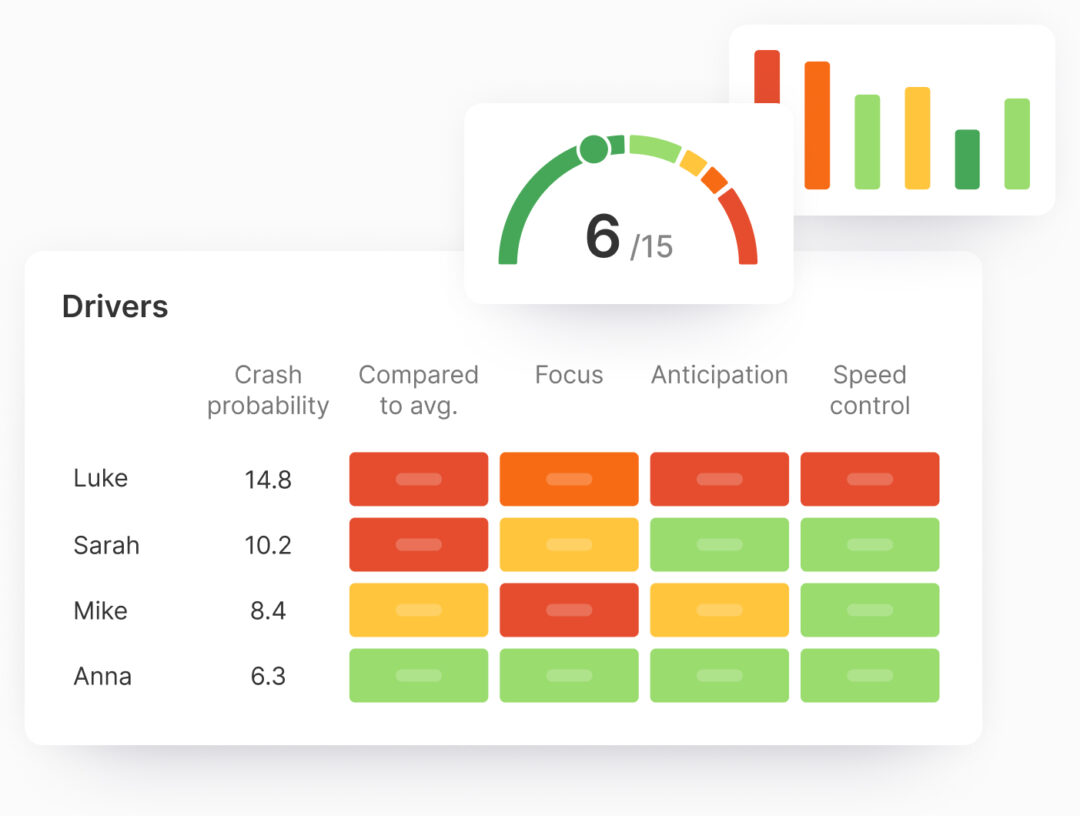
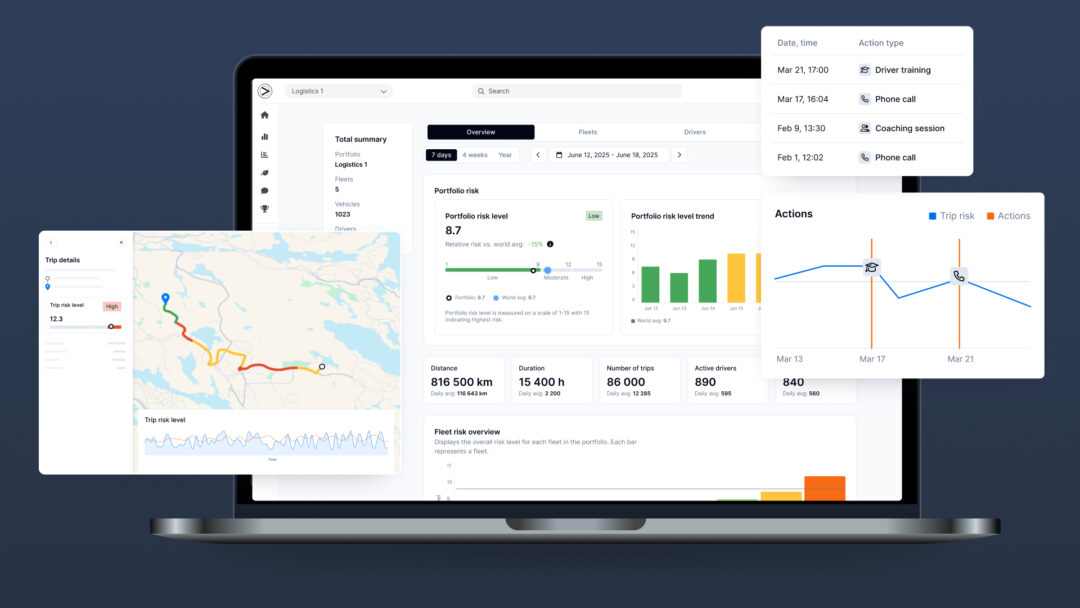
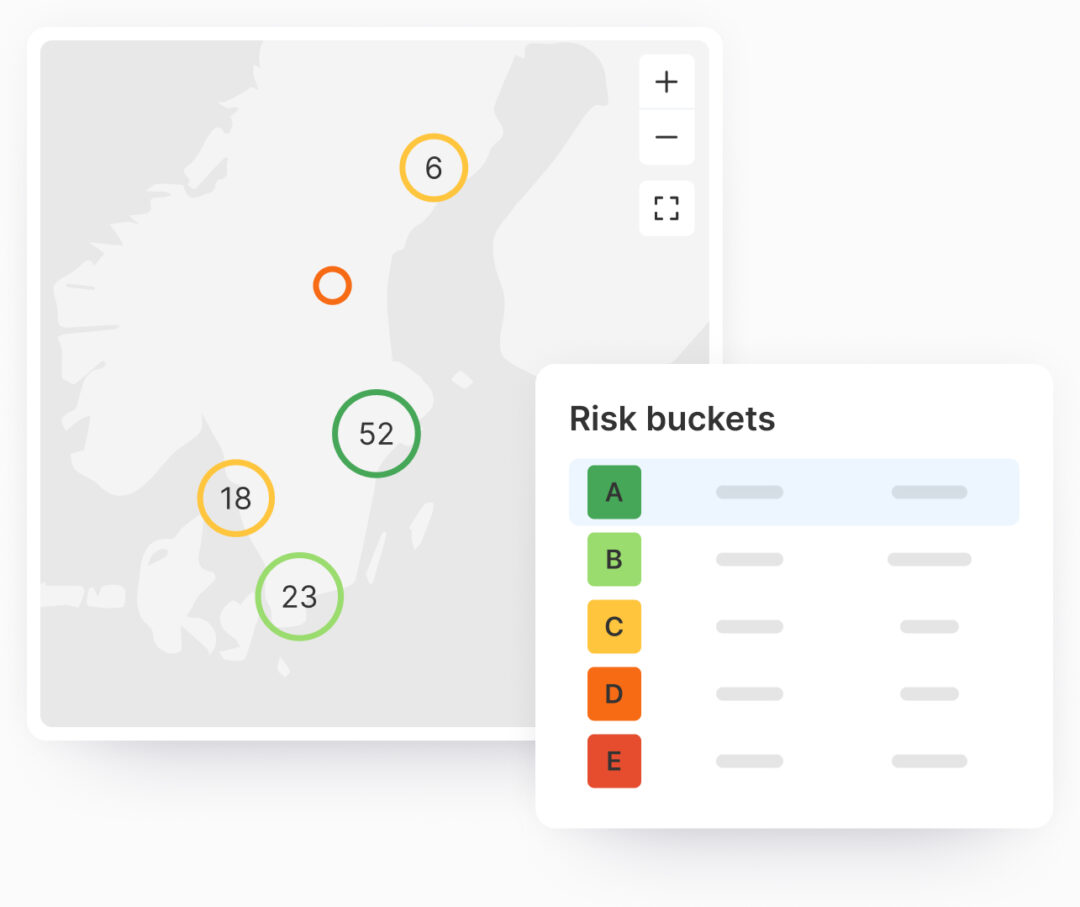
At any given time, see the drivers most likely to be involved in a crash and why, along with recommendations to reduce risk. Filter information as required, such as “50 drivers with highest crash risk”. For each driver, log action taken and monitor progress. Use to:

  • Mitigate driver risk
  • Prioritize driver training
  • Recognize and reward safe behaviors

Products to suit your needs

Predictive, data-driven insights into driving risk.

Visual overview of crash probability and risk trends.

Hands-on tool to predict crash probability and take action.

Book a demo

Get in touch for a no obligation walkthrough of how our products can help your business.

A dashboard showing crash probability stats on mobility

Fill in the form to request a demo