Greater Than and Smart Eye Deepen Collaboration with Predictive Risk Scoring Read press release
Go back
Cars driving on a highway with skyscrapers in the background. Module on the side is showing time risk distribution

Track risk performance

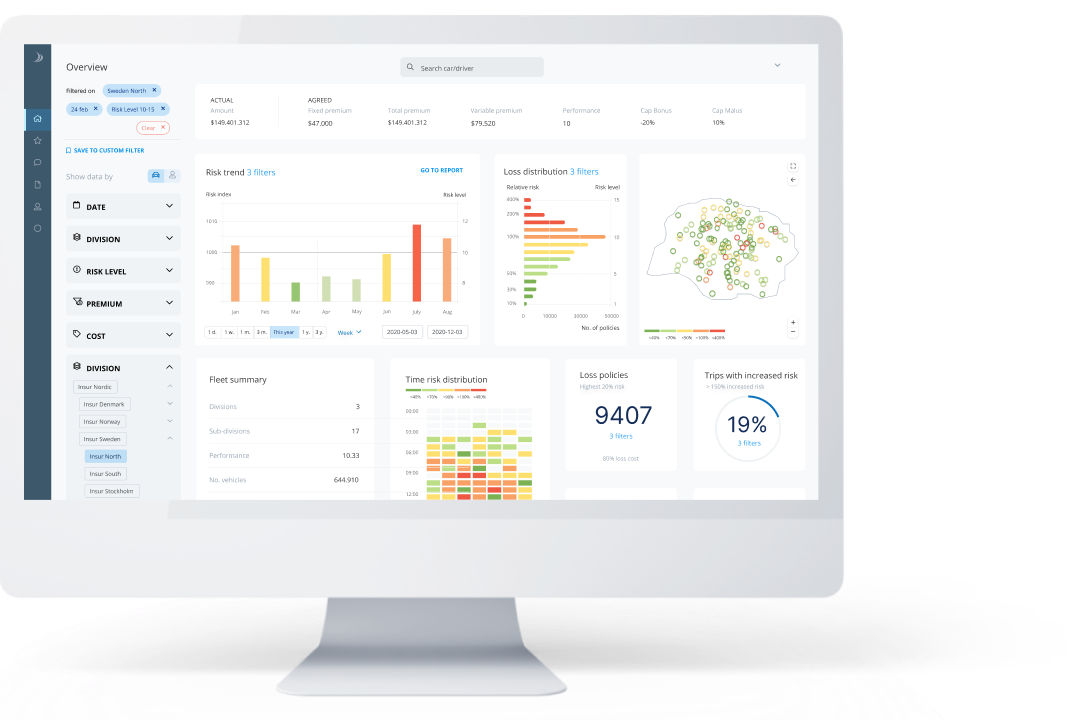
Understand and track risk performance across an entire driving population. Whether it’s for pricing, risk management, or risk mitigation, tracking risk performance is essential for evaluating progress vs benchmarks or KPIs.

A diagram showing driver risk over a week and a widget by it's side showing a crash probability score.

Monitor the stats that matter to you

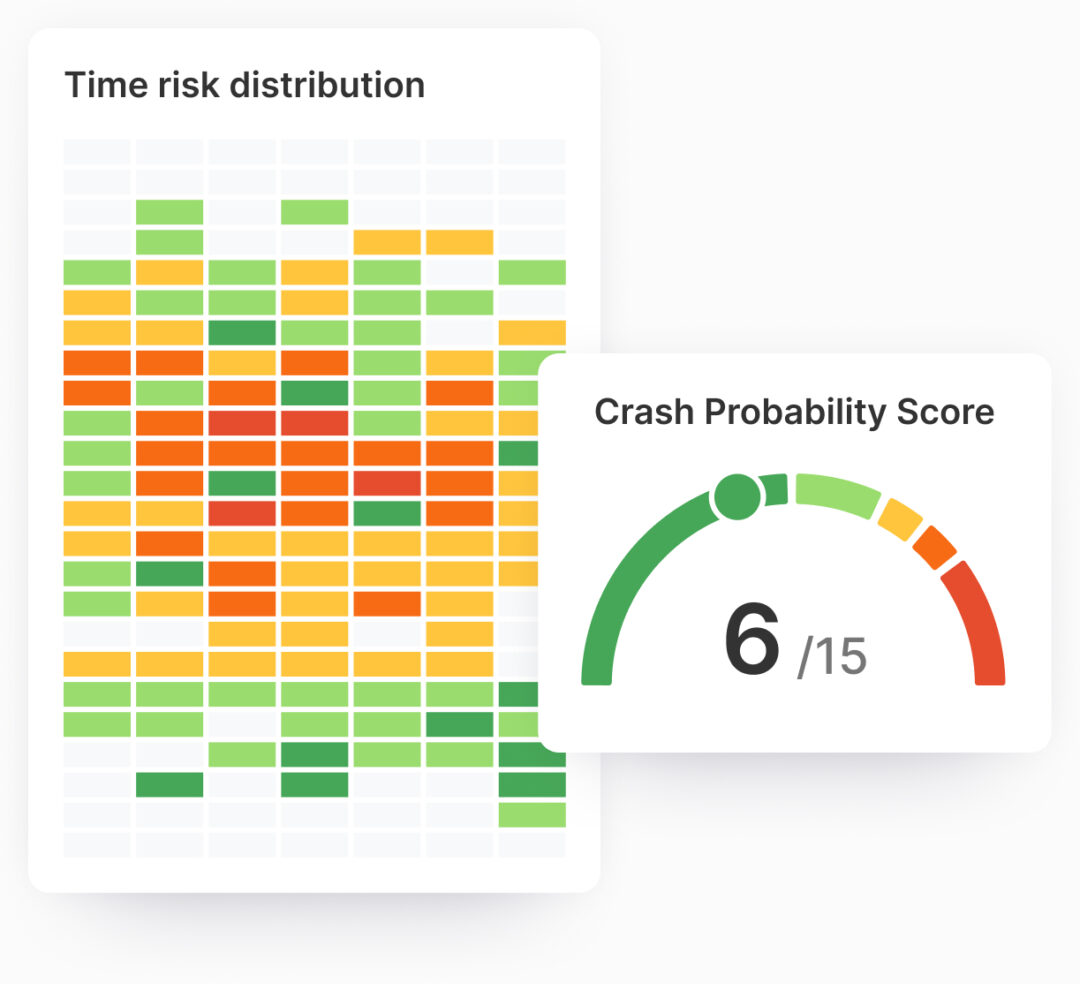
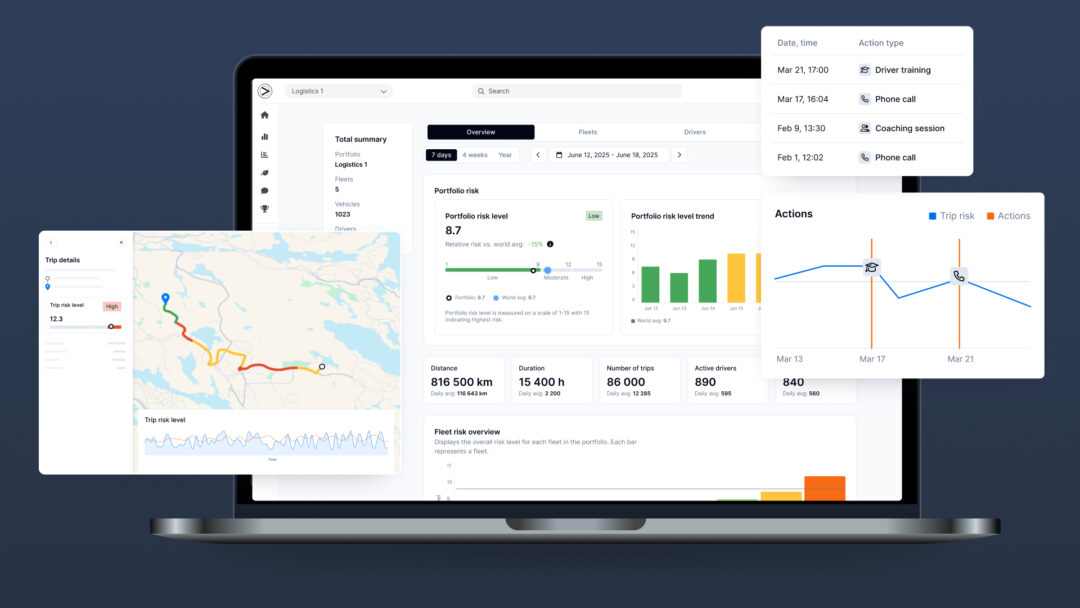
Observe and track driver risk level, see trends and view progress at an organizational or driver level. Keep track of how risk is evolving based on your selected benchmarks or KPIs including:

  • Trends over time, including day, week, month, year
  • Tracking at driver level, following mitigation action
  • Performance vs company or global average
Three cards showing data. One showing developer code on driver risk data, one with a graph of risk level distribution and one showing risk trend.

Data customized to your needs

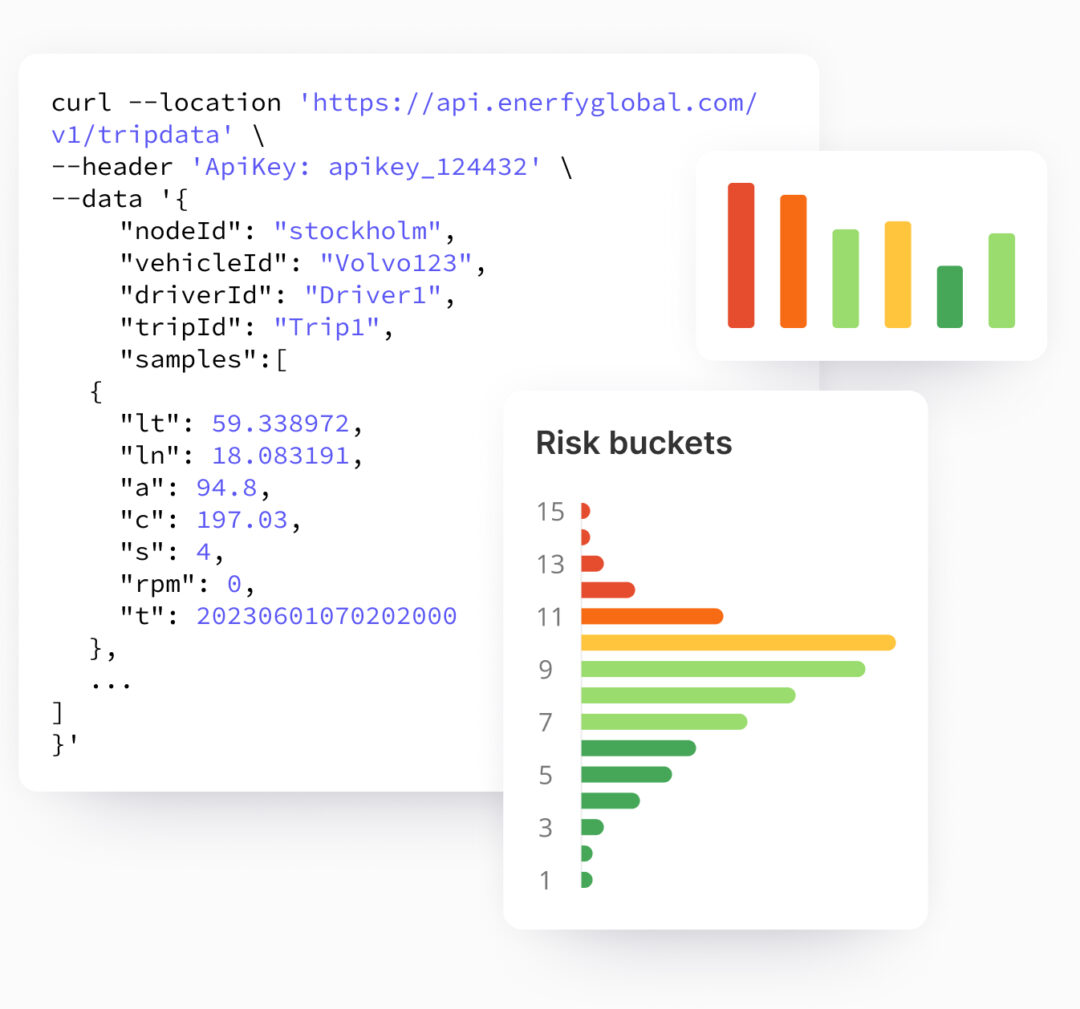
Track driver performance in a way that suits you and your organization. Share your existing driving data with us to access new risk intelligence within your own portal, the Greater Than platform, or as individual modules via an API. Use to:

  • Set KPIs and monitor progress
  • View ongoing risk across your portfolio or customer base
  • Track risk mitigation action

Products to suit your needs

Predictive, data-driven insights into driving risk.

Hands-on tool to predict crash probability and take action.

Book a demo

Get in touch for a no obligation walkthrough of how our products can help your business.

A dashboard showing crash probability stats on mobility

Fill in the form to request a demo