Greater Than and Smart Eye Deepen Collaboration with Predictive Risk Scoring Read press release
Go back
Smiling man driving a car with two overlaid performance metrics: a focus score of 68 out of 100, and an anticipation score of 81 out of 100. Both metrics are shown as progress bars.

Identify the factors behind risk

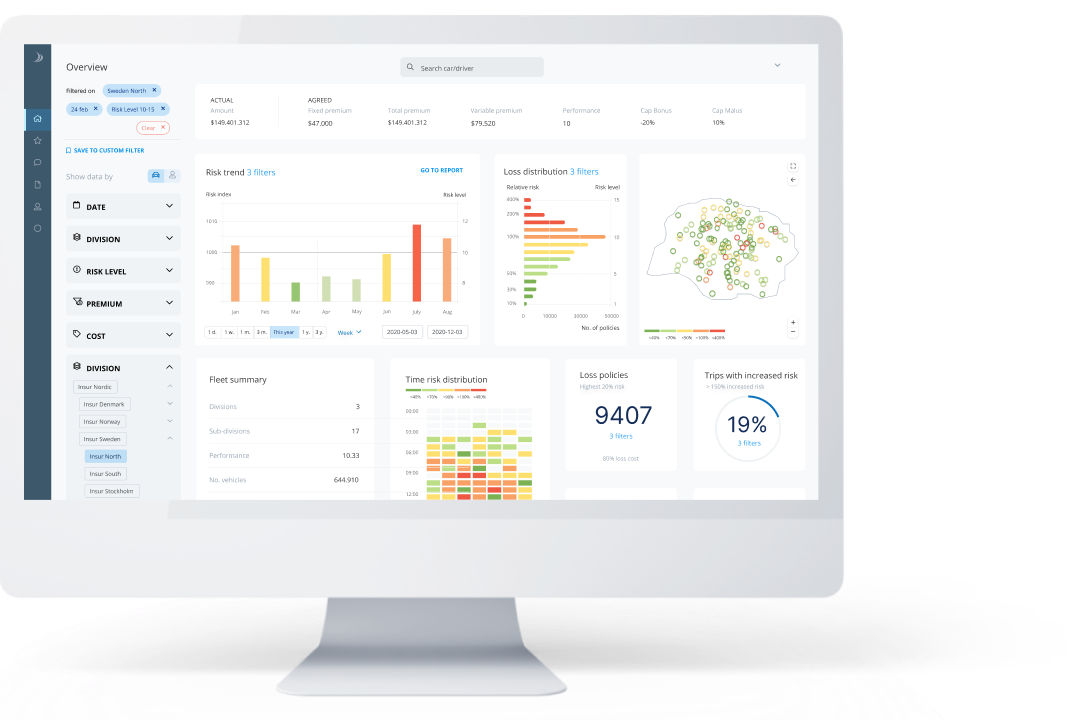
Understand the factors behind driver risk level so you can take proactive, targeted action to manage and mitigate. With valuable risk intelligence into contributory factors to risk, you can take faster decisions to prevent road crashes and protect your business.

A table showing a driver list with numbers on crash probability. A widget on the side shows a spider chart on factors behind driver risk such as focus, planning, speed control etc.

What’s affecting risk level

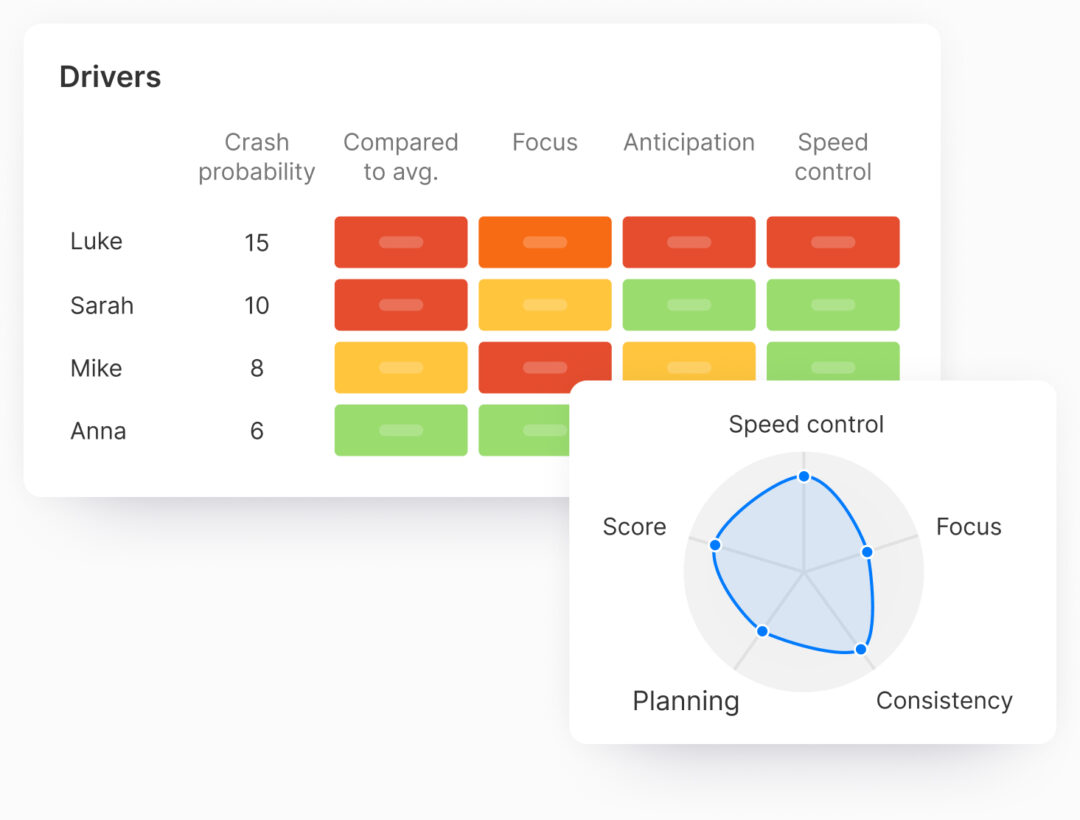
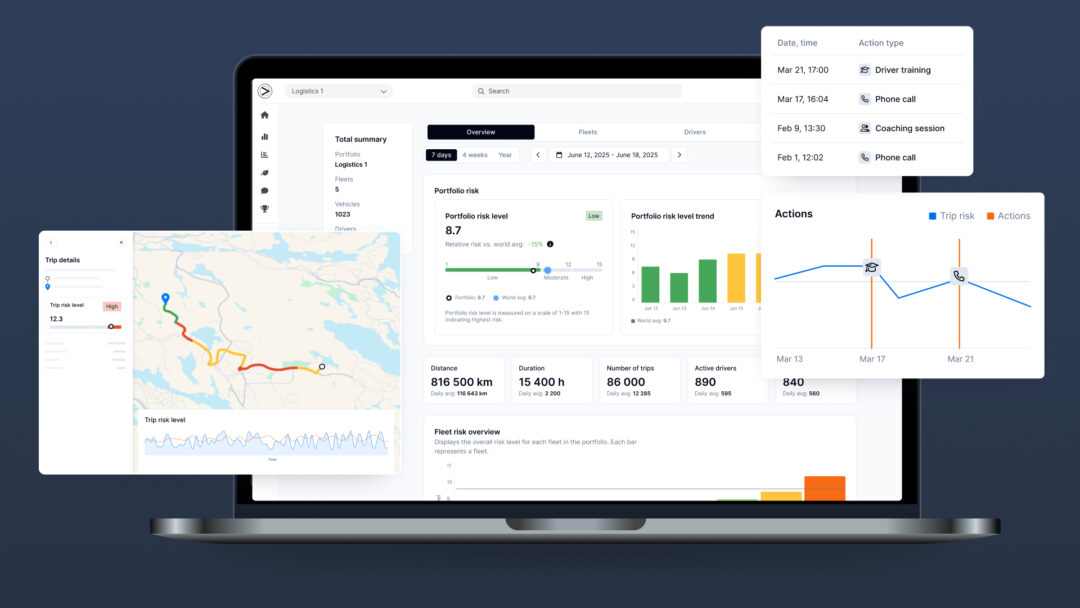
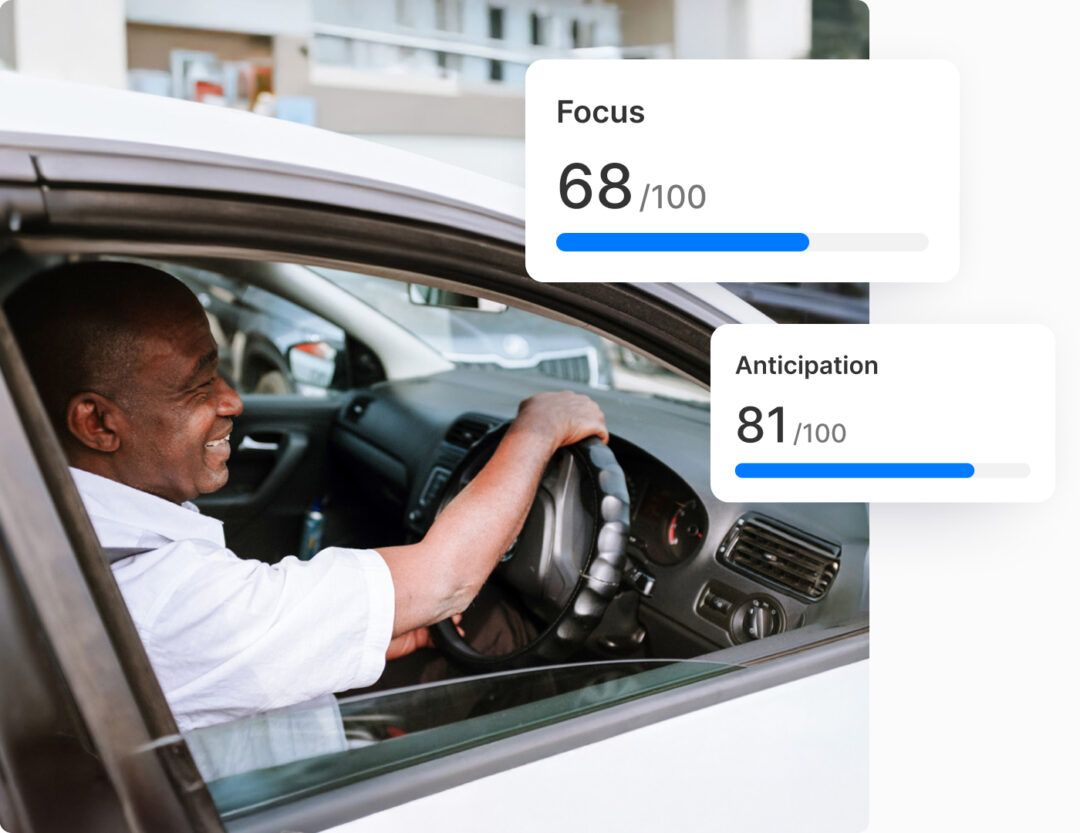
Risk level does not remain static, and requires a proactive approach to predict and prevent road crashes. With our risk intelligence tools, you can identify the factors contributing to risk level, such as focus, anticipation and speed control. See:

  • Driver risk level, ranked highest to lowest
  • Factors contributing to individual risk
  • Changes in risk level over time
A bar chart showing crash probability decreasing and a notification saying

Proactively reduce risk

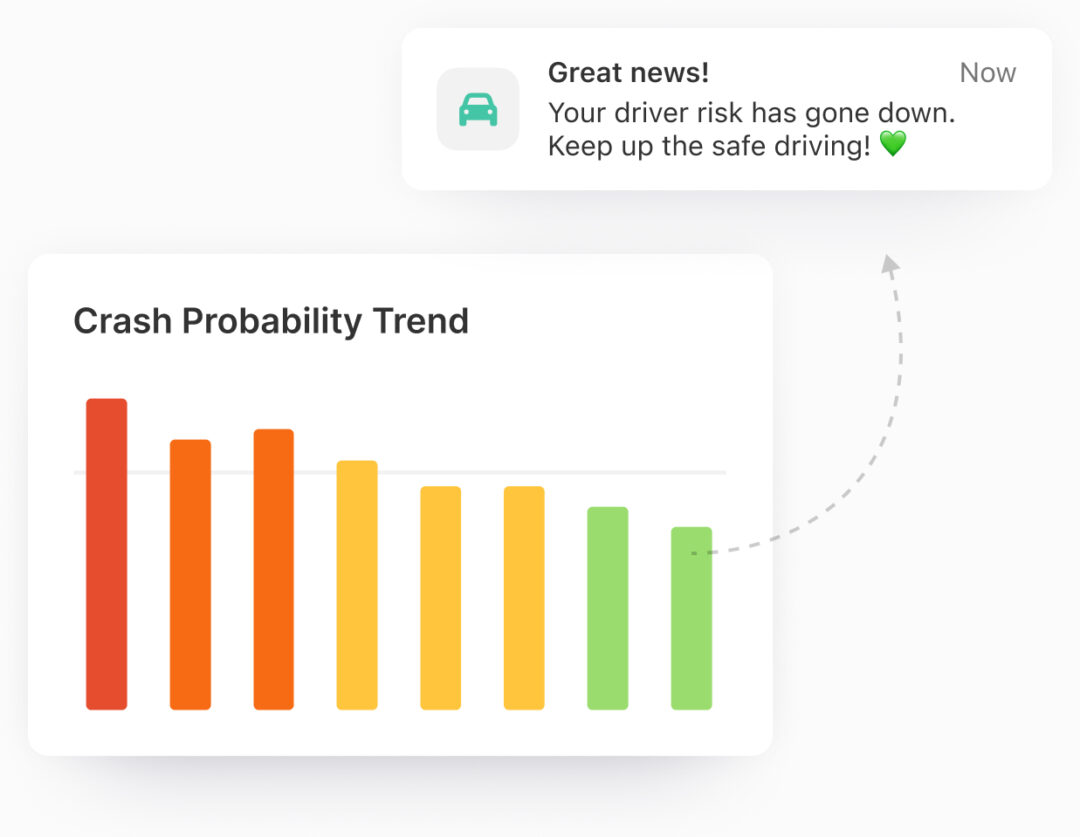
By understanding what is affecting driver risk levels, you can be confident that you’re taking the right action at the right time to mitigate risk. With our hands-on risk mitigation tool, you can:

  • Understand and mitigate risk
  • Prioritize driver training
  • Warn or reward drivers

Products to suit your needs

Predictive, data-driven insights into driving risk.

Visual overview of crash probability and risk trends.

Book a demo

Get in touch for a no obligation walkthrough of how our products can help your business.

A dashboard showing crash probability stats on mobility

Fill in the form to request a demo