Greater Than and Smart Eye Deepen Collaboration with Predictive Risk Scoring Read press release
Go back
Overhead view of a congested urban street with cars in traffic, accompanied by a data overlay showing crash probability is 19% lower than the world average, visualized with a green-to-red scale.

Benchmark risk

Benchmark your performance to identify areas for improvement, adjust strategies, set performance goals and monitor progress over time.

Two dashboard-style graphs comparing fleet risk: one showing driver risk trends against fleet and world averages, and another summarizing overall fleet risk compared to portfolio and world benchmarks.

Benchmarking for action

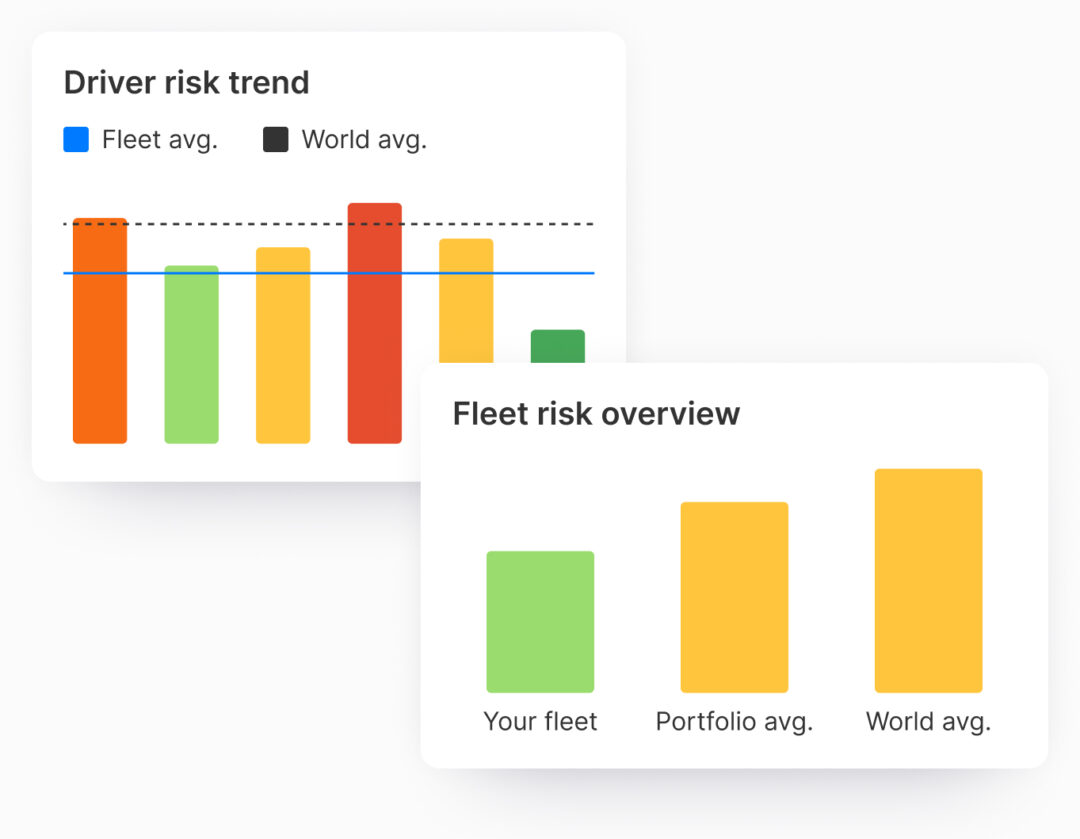
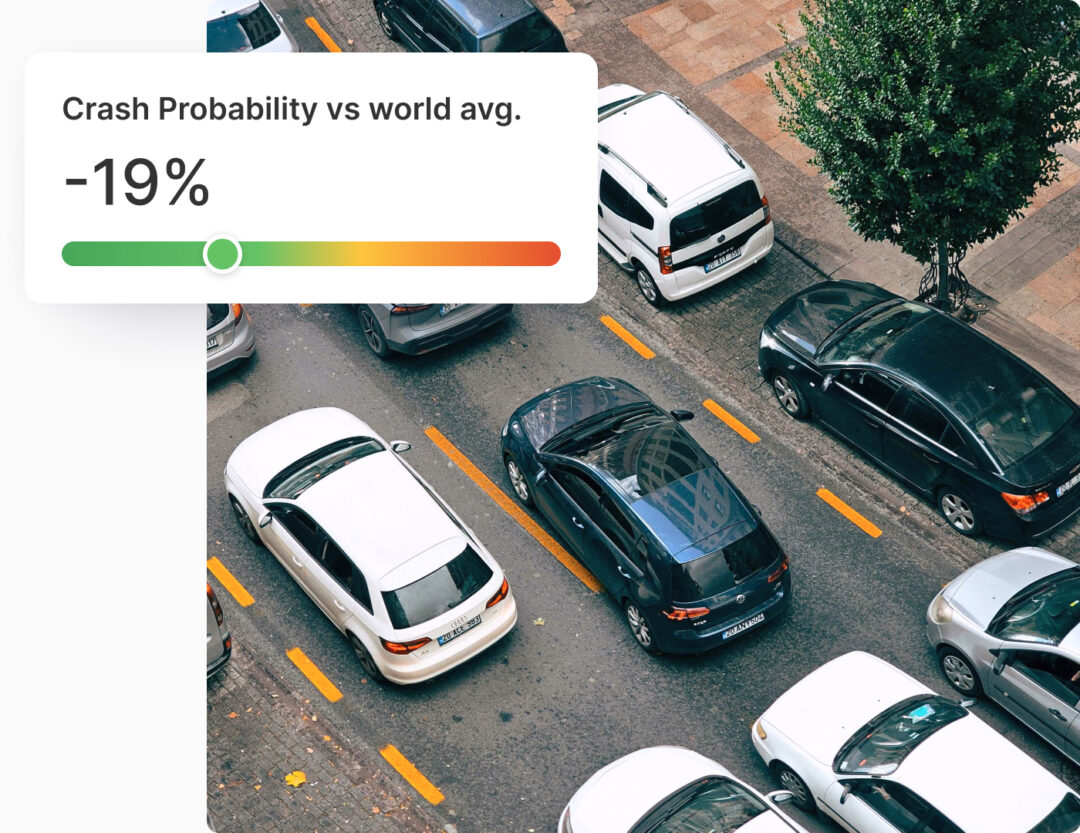
Improve your operations by seeing how your organization’s risk level compares to others. Our Crash Probability Score makes it easy to conduct benchmarking at various levels:

  • Portfolio compared to country and world average
  • Fleet compared to portfolio, country and world average
  • Driver compared to fleet, portfolio and world average

Products to suit your needs

Predictive, data-driven insights into driving risk.

Visual overview of crash probability and risk trends.

Hands-on tool to predict crash probability and take action.

Book a demo

Get in touch for a no obligation walkthrough of how our products can help your business.

A dashboard showing crash probability stats on mobility

Fill in the form to request a demo