


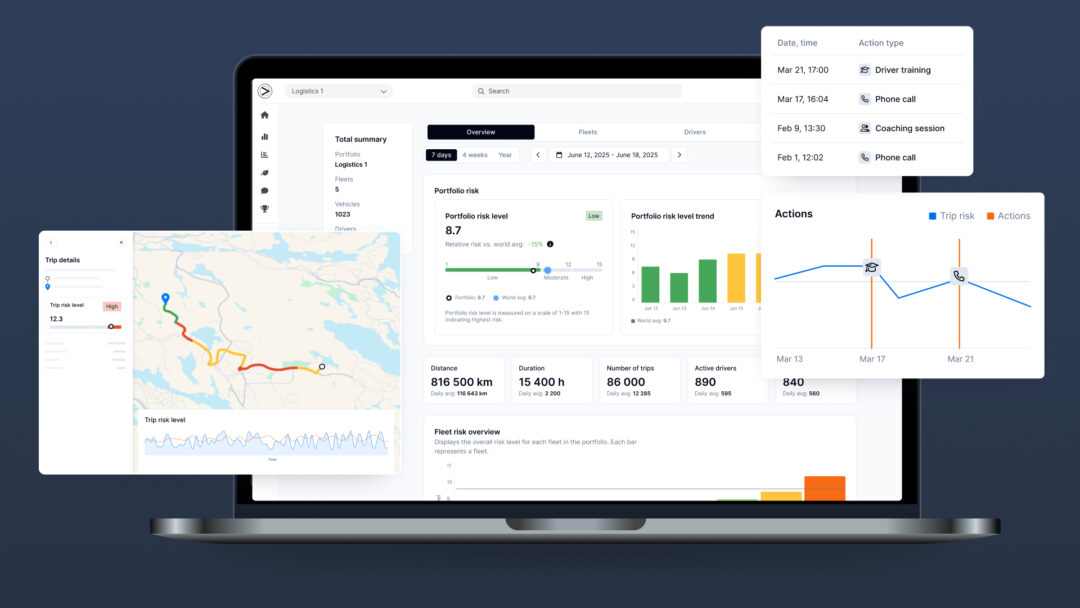


Greater Than is a driving data analytics company that specializes in understanding driver impact on the roads. Through the power of artificial intelligence (AI), Greater Than converts GPS data into driver scores that predict crash probability and climate impact. The scores can be further enhanced with additional intelligence including an analytics dashboard, prevention tool, and summary reports.
Insurance companies, underwriters, fleet solution providers, mobility providers and other owners of GPS data use Greater Than’s analysis to optimize driver risk management, achieve insurance profitability, manage sustainability & ESG reporting, and monetize GPS data.
Our patented pattern AI technology enables us to understand driver impact on the roads in a unique way. Unlike other data analytics companies, we can identify the driver influence on crash probability and climate impact. In other words, how a person’s driving influences road safety and CO2 emissions / energy consumption.
Thanks to the uniqueness of our scoring, our AI harmonizes GPS data from any source and is agnostic of location or vehicle type, making it easy to benchmark performance across mixed fleets and quickly pinpoint areas for potential CO2 emissions reductions and driver safety improvements.
We have several customer case studies that can be viewed here: https://greaterthan.eu/resources/category/customer-cases/.
We also have many anonymized examples of end-user improvements, which we can share on request.
We operate on a SaaS model, with no long-term commitment. Customers pay for the AI analysis on a user per month basis. Additional services are available for the analysis, which in most cases are also paid for per user and per month.
We analyze per-second GPS driving data to create a DriverDNA for each trip. We compare the DriverDNA against our database of over 7 billion patterns to rapidly determine crash probability and climate impact.
Pattern AI works in a similar way to facial recognition. But instead of comparing data to known faces, it compares it to a database of vehicle trips, and their outcomes. Because the AI is trained with damage data, saved CO2 emissions and fuel consumption, we’re able to analyze trips in real-time and predict actual outcomes.
Read our blog post where we explain it further.
We continually train the AI with new data. And, although the core of the model isn’t influenced much by new data, our capabilities in predicting type and severity of crash are constantly evolving. This helps our customers to predict not only who will crash but also what type of crash they are likely to be involved in; for example, a rear-end collision, or minor scrape. This is powerful knowledge that will further strengthen risk mitigation and prove transformative across the insurance industry.
We look at real world trips and their outcomes, whether they involved a crash or not, and their fuel consumption. We then analyze a driver’s movements through an ENTIRE trip – not just events – to create what we call a DriverDNA of the trip, which we compare against existing trips in our database to look for similarities. This is pattern profiling. We currently have over 7 billion driving patterns in our database, trained with data from 106 countries and 1,600 cities.
Our AI is regularly validated by customer outcomes.
Additionally, our AI has received many awards and recognitions.
We predict a driver’s crash probability and climate impact. Collectively, we call this a driver’s impact on the roads. We calculate driver impact by analyzing a driver’s movements through an entire trip and not “events” like harsh braking, harsh acceleration or speeding.
Our AI is based on outcomes we know have happened, and by training it extensively over the last 20 years and working with companies globally, we’ve been able to see just how accurately it can predict risk and climate impact.
Our AI is trained with trip data from all kinds of vehicles and has learned how to make driving comparisons no matter the size of the vehicle or type of vehicle.
Not by using any sensors on the vehicle but people change their driving patterns according to weather conditions. Our AI detects these changes and makes an accurate pattern analysis no matter the weather.
Data is only tracked when vehicles are driven.
All data within the Greater Than cloud provides full protection of personal data using the latest encryption technologies – this protects and ensures the highest privacy level, in line with GDPR.
Safe driving and eco-friendly driving have a very strong correlation. But there are a few rare cases where they don’t match exactly. For example, having consistent speed for as long as possible on a curvy road is good for fuel consumption- but can be very bad for safety if it means the driver has to brake hard or do quick cornering!
Yes, thanks to the uniqueness of our scoring, our AI harmonizes GPS data from any source and is agnostic of location or vehicle type, making it easy to benchmark performance across mixed fleets and quickly pinpoint areas for potential CO2 emissions reductions and driver safety improvements.
Drivers are placed into risk groups based on how safe or risky they drive their vehicles. Risk group one (1) is the lowest risk of driving and 15 the highest risk of driving. The world average driver is between 9 and 10. The higher the number, the higher the probability of a crash.
Our AI is constantly looking ahead; this means it continually compares what’s happening during a trip to determine what the outcome, will be. And this prediction is dynamic, so it is always re-calculating the outcome dependent on the actions of the driver.
Read more about it in our blog post about how the scoring works.
No, our AI does not use speed limits.
Our AI makes a full pattern analysis of all driving data including all braking, acceleration and coasting. It finds the risk based on the full pattern rather than just single events.
Crash risk changes all the time, and data confirms that driving crash-free for many years does not necessarily mean your crash risk is low. In fact, research shows that experienced drivers CAN become complacent and forget just how dangerous driving can be.
A high-risk score could be the result of a few risky decisions or a few lapses in concentration – there are many factors that have been considered in calculating your score. Remember that the score is not a reflection of your skills or your experience, but an analysis of your real-time attitude on the road.
In many cases this is based on surrounding factors or as we call it “Surrounding risk”. During weekdays there are many drivers on the roads mostly meaning a “slower pace”. A “slower pace” in combination with many people on the road means that the possibility for making high risk decisions becomes smaller.
If you look at typical weekends, there are normally fewer people on the road, giving more opportunity for high-risk decisions. The difference between the safest drivers and the highest-risk drivers is heavily increased during weekends meaning that even the safest drivers suffer a greater risk based on other surrounding high-risk drivers.
We know this is a difficult concept to grasp, so we’d be happy to explain in person if required.
Focus, Anticipation and Speed Control are three major contributors to high-risk driving. Therefore, addressing these three areas is likely to improve your score.
Our AI uses pattern profiling to analyze and calculate the driver’s impact on CO2 in (%). Drivers/Trips are benchmarked against all other real previous drivers/trips made and the (%) compares how the driver performs compared with the average driver.
When vehicle specifics are included, we can also calculate real CO2 emissions in grams.
The uniqueness of our scoring means that, in addition to calculating total emissions, we can identify a driver’s personal influence on emissions as a result of their attitude.
Similar to what we do for combustion vehicles (please refer to “Climate” above). The main difference between a combustion vehicle and an EV is obviously electricity. EV’s do not directly emit CO2 while driving but producing the electricity to charge them emits CO2. A used kWh can be translated into CO2 in grams, hence total emissions and the driver’s impact on emissions may be calculated.
Our scoring forms the basis for many tools and products that organizations use to suit their business needs. This includes solutions for risk mitigation, insurance pricing, sustainability management and ESG reporting.
All that’s needed is GPS data.
GPS data can be shared with us via a smartphone app, SDK in an existing app or API from dashcam, connected car, telematics device, or other system.
1-5 seconds.
To be able to start analyzing your data and gain valuable insights into your fleet or driver portfolio you will need an Enerfy Global account and an associated API key.
First, login or create an Enerfy Global account.
Next, request an API key. Following authentication, we will provide your API key which is your unique identifier, serving as your personal credential for you to access our services.
Read our API documentation.
That’s fine! We can return the data to you via an API or iFrame for visualization in their own solution. Alternatively, we can provide a dashboard for visualization, or a white-label app.
Yes! Read our API documentation.
We can start the analysis with 1 km driving data.
Yes! Read our API documentation.
The FIA Smart Driving Challenge (FIA SDC) is a worldwide initiative rewarding smart, safe, and eco-friendly driving. The FIA SDC was created by the Federation Internationale de l'Automobile (FIA) in collaboration with Greater Than to encourage everyday drivers to adopt smarter, cleaner, and safer driving behavior.
When drivers join the challenge by using the FIA SDC app, their climate impact or CO2 emissions avoided is calculated by Greater Than’s AI technology. Data from each trip, including energy consumption and driving behavior (focus and anticipation), is analyzed and transformed into a unique DriverDNA profile which is then compared to a database of over 7 billion DriverDNA profiles to evaluate CO2 and energy savings.
The ‘smart score’ obtained for each participant is used to establish the ranking of the competition.
Every year, the FIA SDC holds a Season World Challenge during which drivers can compete for the title of “World’s Smartest Driver.”
Learn more at fiasmartdrivingchallenge.com
It’s possible to connect the app using an OBD reader or another Bluetooth dongle connection in the car.
It’s possible to connect the app using an OBD reader or another Bluetooth dongle connection in the car.
This is necessary for us to be able to detect drives and analyze the drives/data.
No, we do not.
We avoid using “good” and “bad”. Our scoring predicts crash probability and climate impact but does not judge. Within the FIA SDC app, scores over 1000 are considered to be above average.
We avoid using “good” and “bad”. Our scoring predicts crash probability and climate impact but does not judge. Within the FIA SDC app, scores below 1000 are considered to be below average.
There is no highest limit to what you can get. But so far, we have never seen anyone achieve a score higher than 1510.
The FIA SDC encourages “smart driving”. The definition of this is: