Greater Than and Smart Eye Deepen Collaboration with Predictive Risk Scoring Read press release
Go back
Aerial view of a green, hilly highway interchange with vehicles highlighted in white circles. An overlay displays a bar chart labeled 'Climate Impact Trend', using color-coded bars from red to green to visualize environmental performance over time.

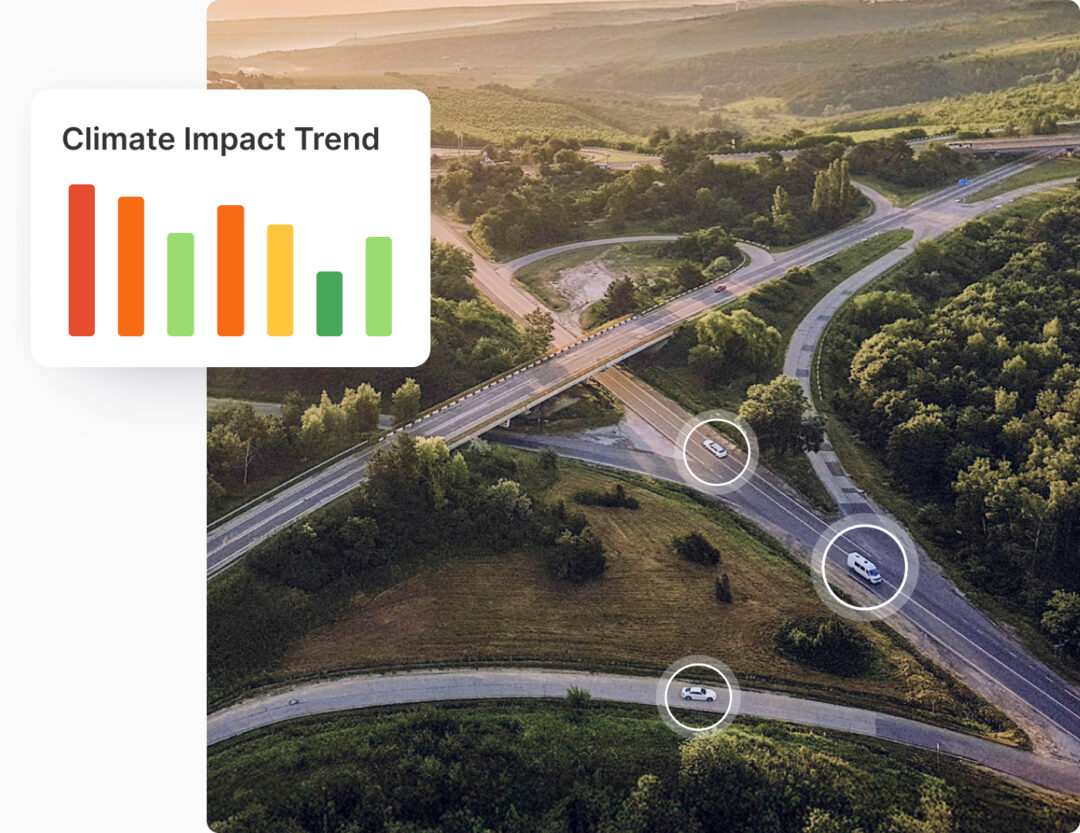
Understand climate impact

Harness AI-powered insights to reveal how driver behavior affects fuel use, emissions, and energy efficiency. With universal scoring across all locations and vehicles (including EVs), benchmarking global, mixed fleets has never been easier.

Dashboard showing regional fleet data with a map highlighting driver clusters and risk levels, a heatmap titled 'Time risk distribution' displaying risk intensity across time slots, and a table comparing the climate and CO₂e impact of three fleets—Fleet A, B, and C—with reductions ranging from -8% to -15% and CO₂e savings up to -2136 kg.

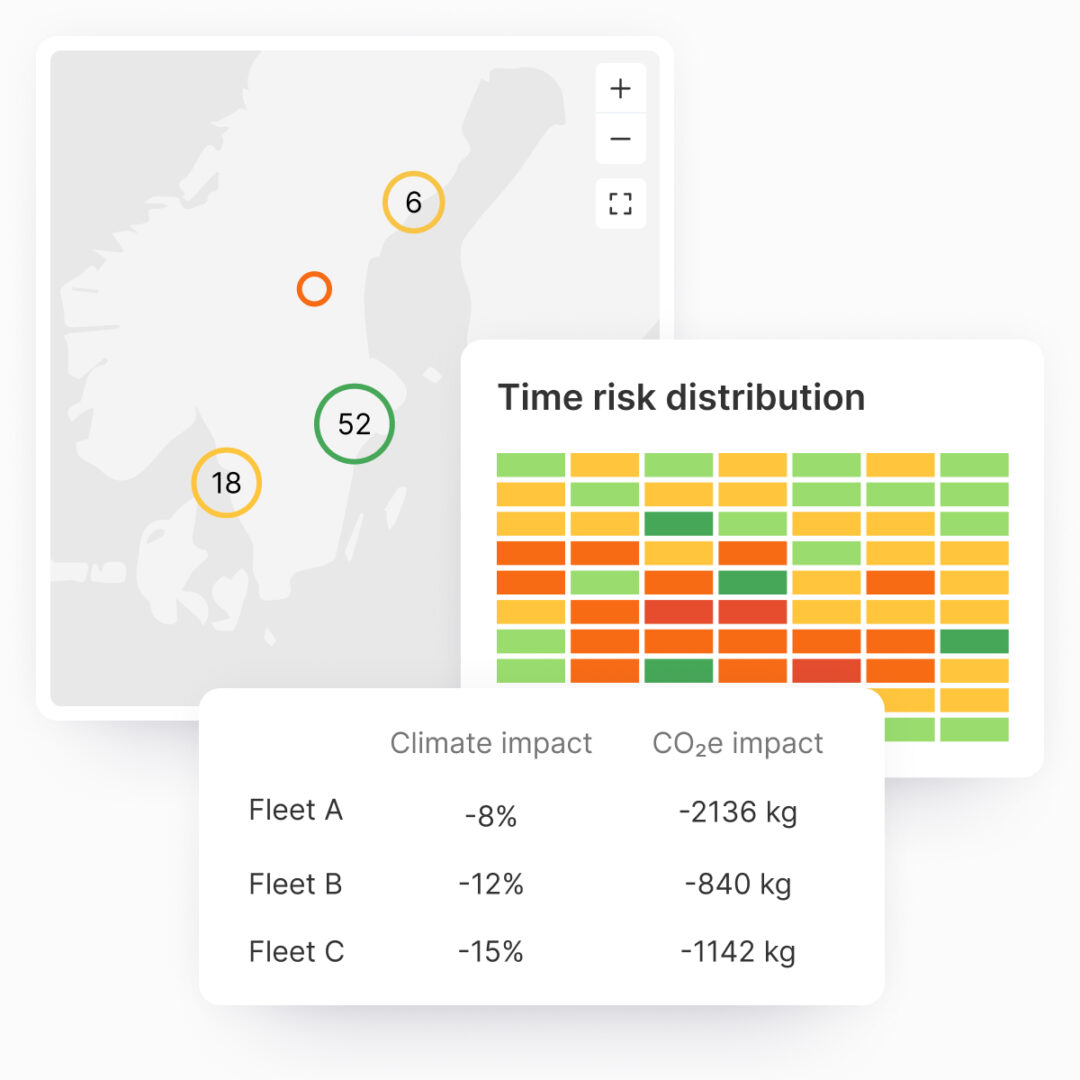
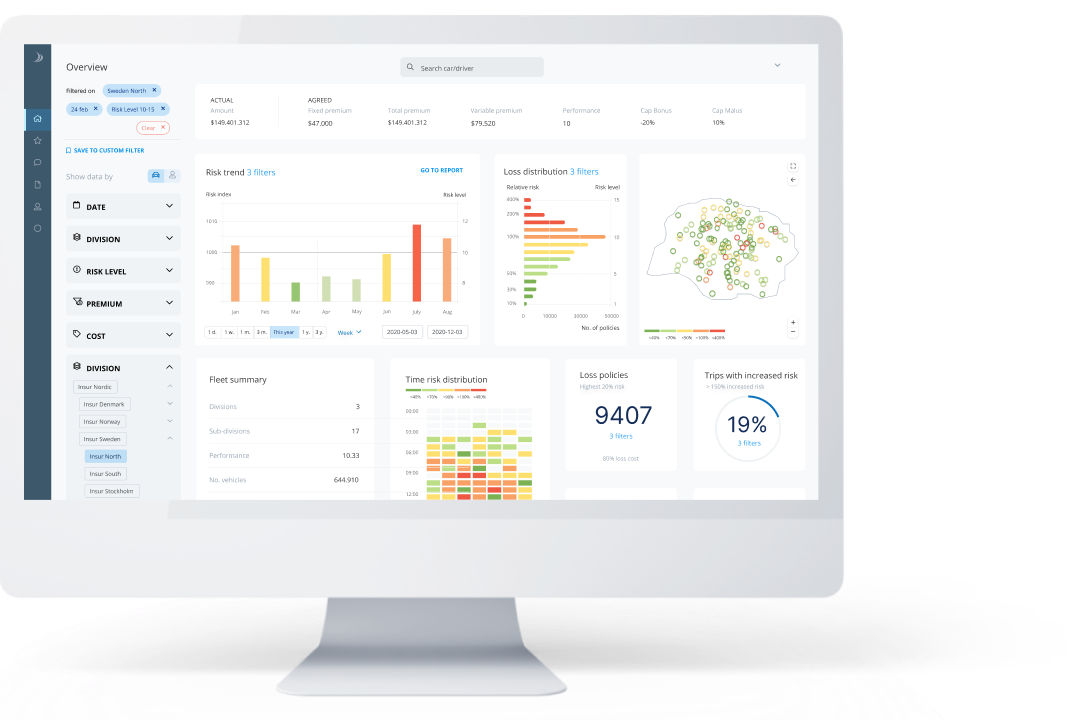
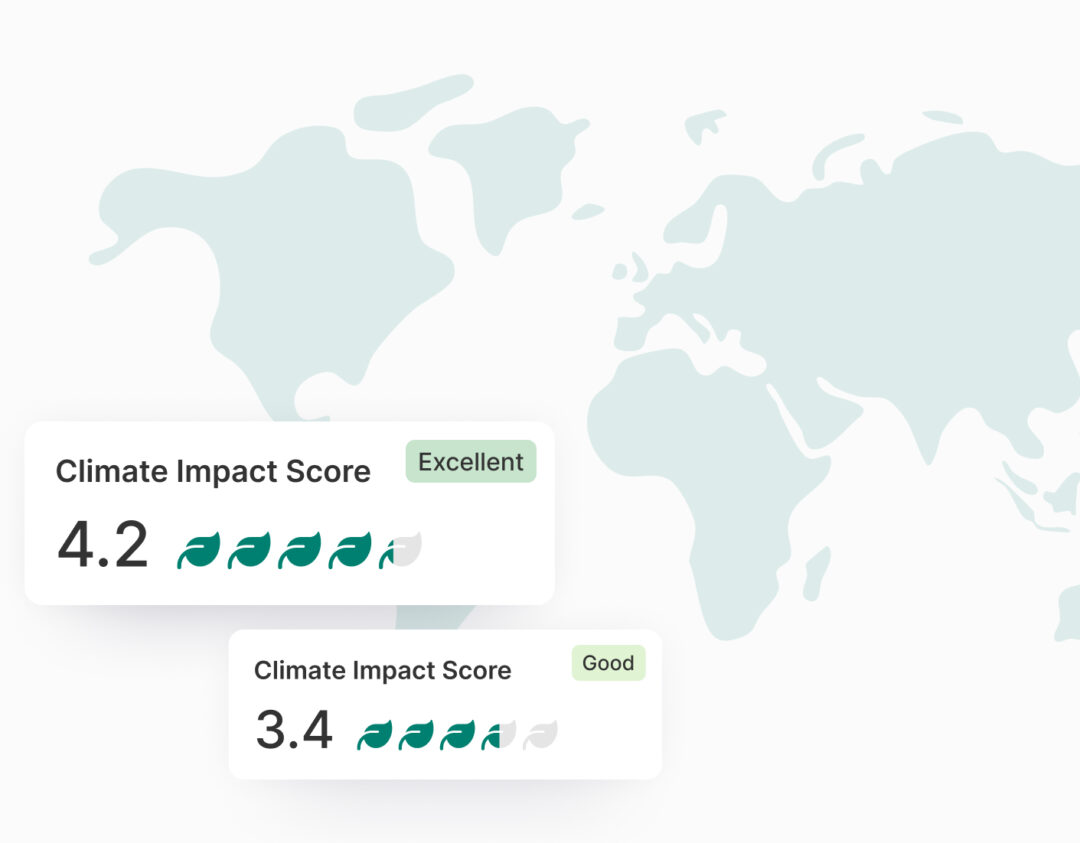
Actionable climate impact data

See how climate impact varies across a global fleet or portfolio, with aggregated data clearly showing areas with highest and lowest climate impact. Identify:

  • The fleets or drivers with most potential for improvement
  • How much emissions/ energy could be avoided
  • Fleets or drivers with lowest climate impact
Stylized world map background with two overlaid climate impact scores. One shows a score of 4.2 out of 5 leaves labeled 'Excellent', and the other displays a 3.4 score labeled 'Good', representing environmental performance ratings on a global scale.

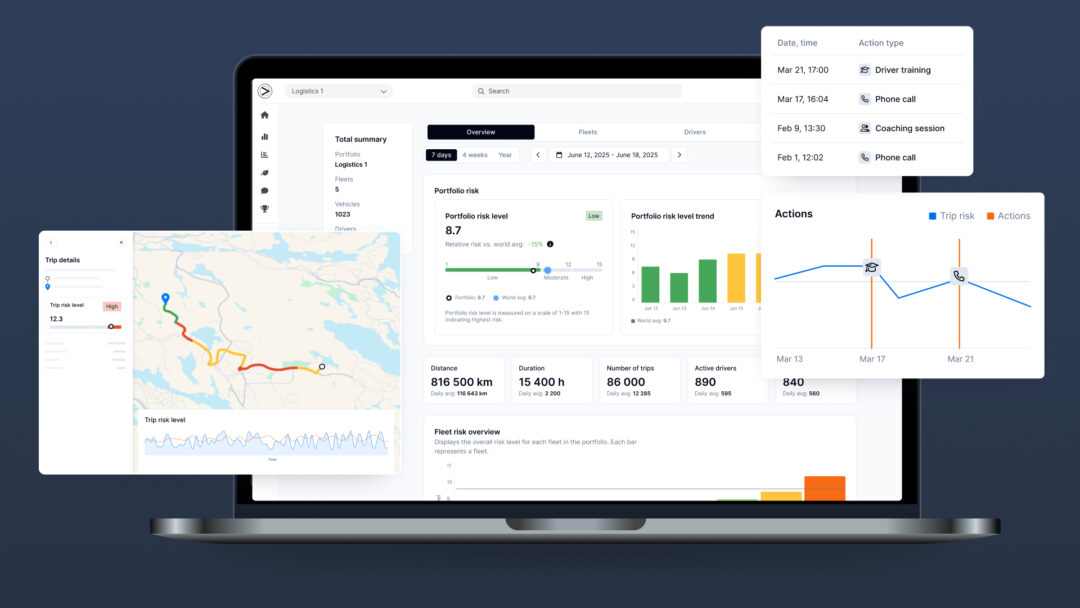
Globally unique scoring

Our climate impact scoring is globally unique in that it identifies the driver influence on climate impact, regardless of vehicle driven. This makes it easy to pinpoint areas for improvement, opening new opportunities in:

  • Customer engagement through driver feedback
  • Sustainability management and ESG reporting in mixed fleets
  • New product development

Products to suit your needs

Real-time insights to quantify climate impact.

Visual overview of driver climate impact and trends.

Book a demo

Get in touch for a no obligation walkthrough of how our products can help your business.

A dashboard showing crash probability stats on mobility

Fill in the form to request a demo