


Crash Probability Hub
The Crash Probability Hub is a comprehensive risk management platform that transforms the way you visualize, understand, and reduce driver risk. Collating deep AI-generated risk insights from across your entire driving population, the Hub enables informed decisions, fast.
See more risk
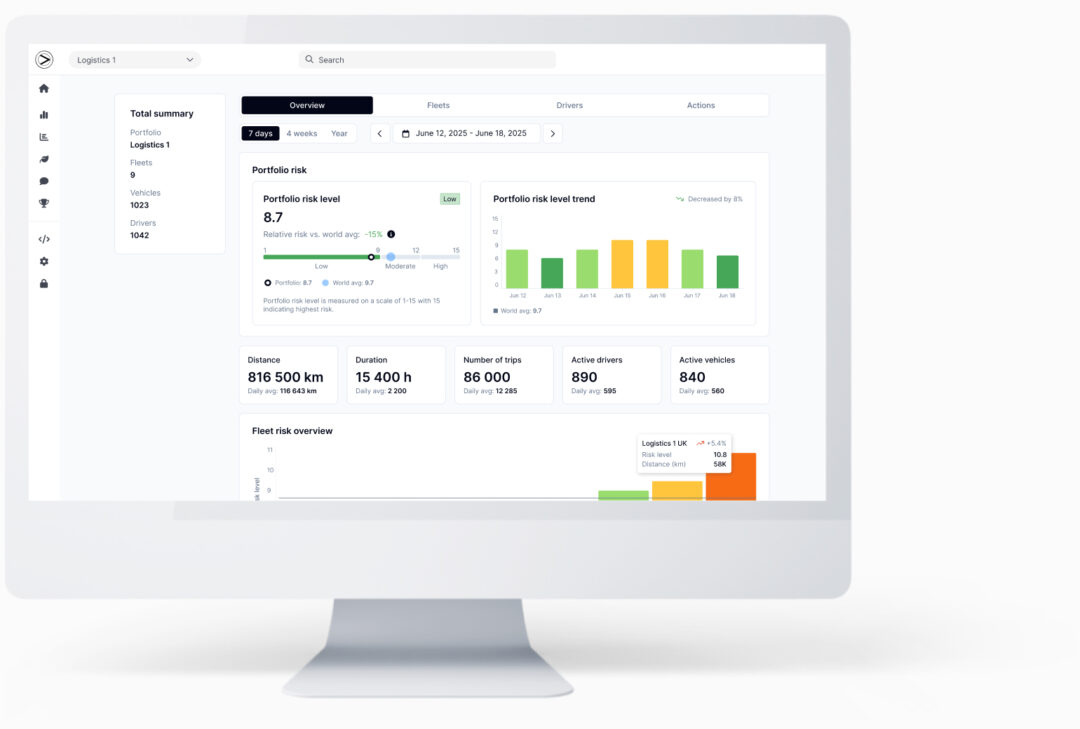
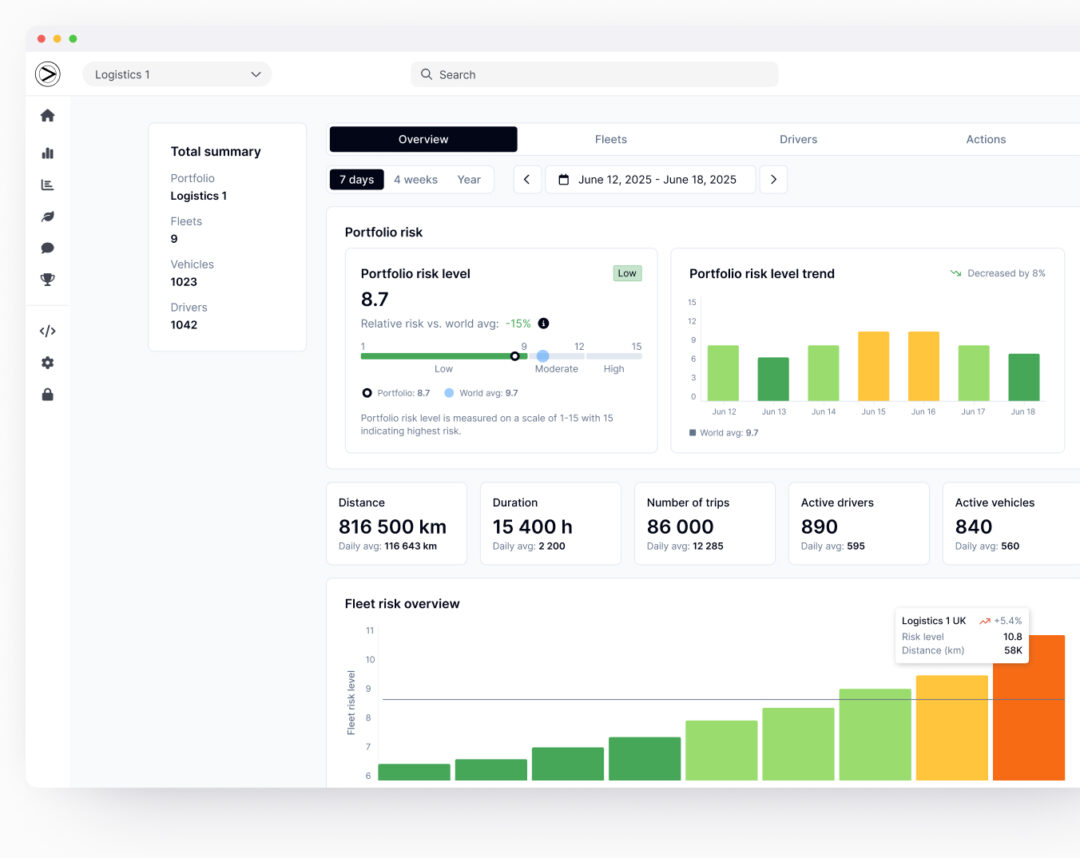
Gain a new understanding of risk thanks to the Crash Probability Hub’s extensive AI insights that dig deep into driving data, helping you take greater control of risk across your organization.
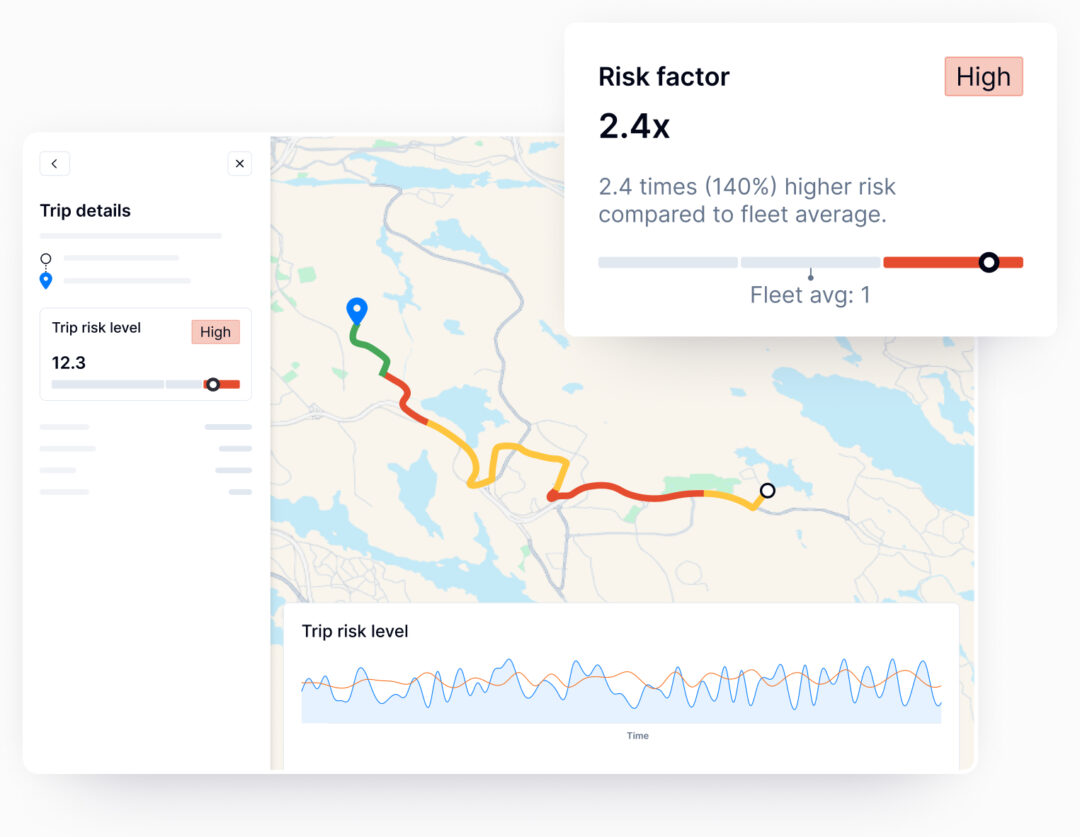
- Visualize risk at portfolio, fleet, driver, vehicle and trip level
- Quantify driver crash risk relative to other drivers in the company or worldwide
- See how exposure and behavioral factors contribute to risk
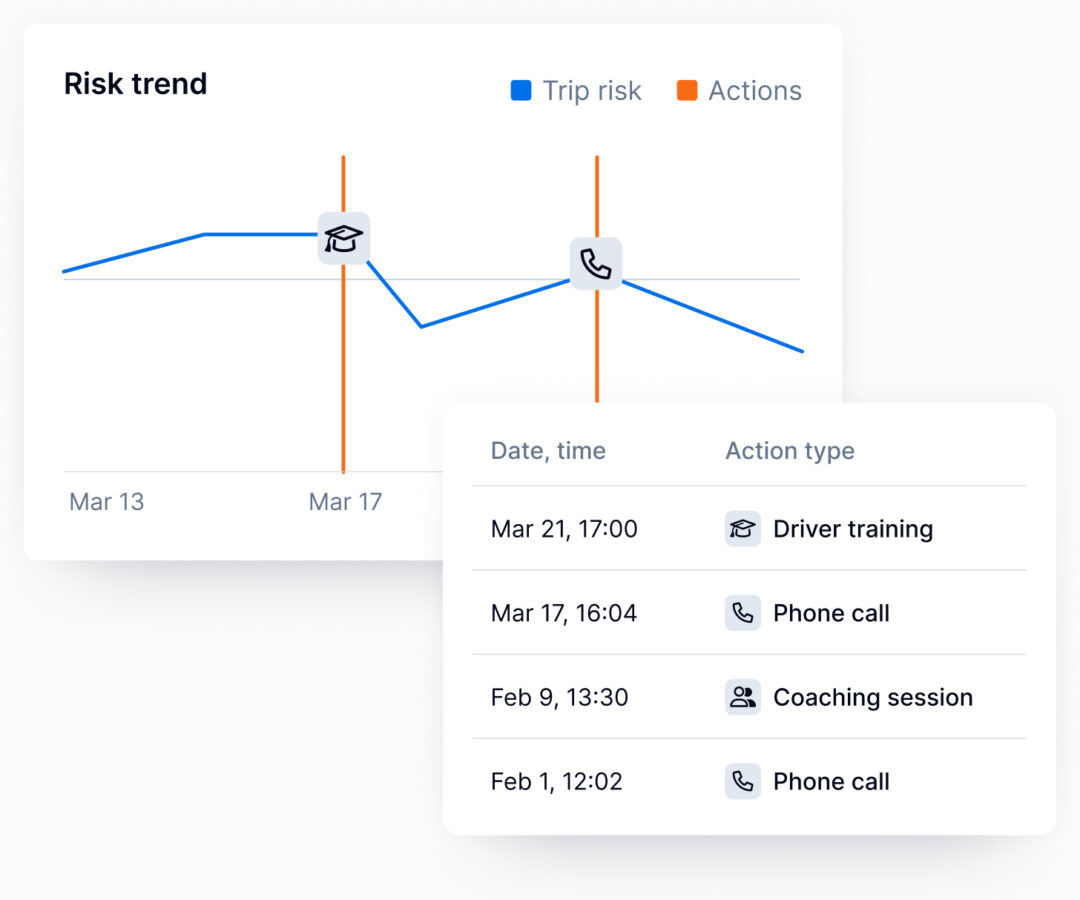
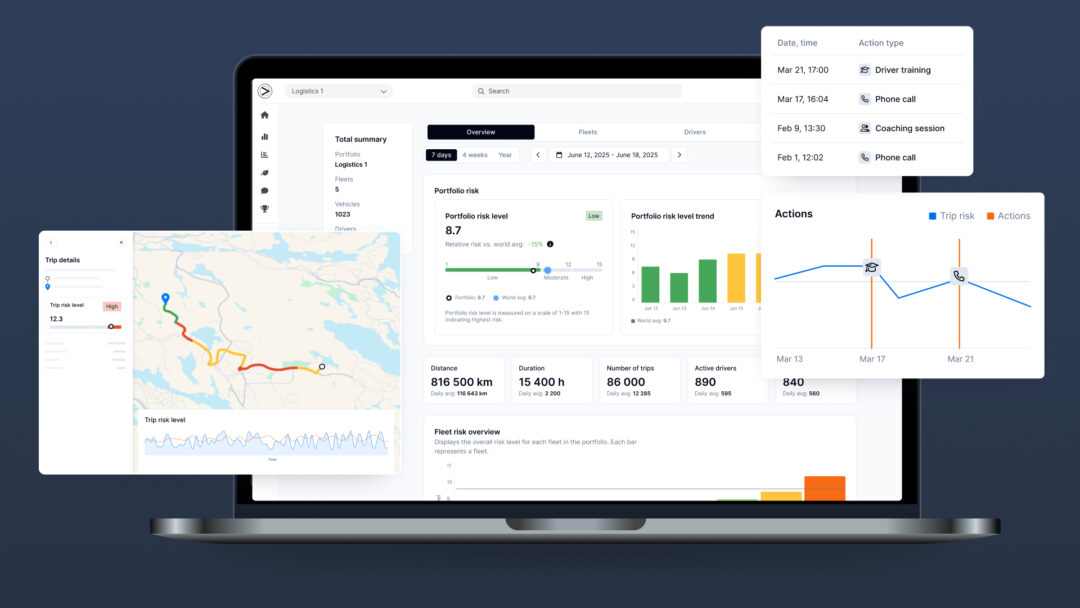
Take targeted action
By providing a deeper picture of risk across your organization, the Crash Probability Hub not only predicts who is likely to crash next and why, but accelerates action to manage and mitigate risk.
- Detailed insights into contributory factors to risk
- Risk exposure overview including trips, distance, duration
- Tools to action risk and seamlessly log and track interventions
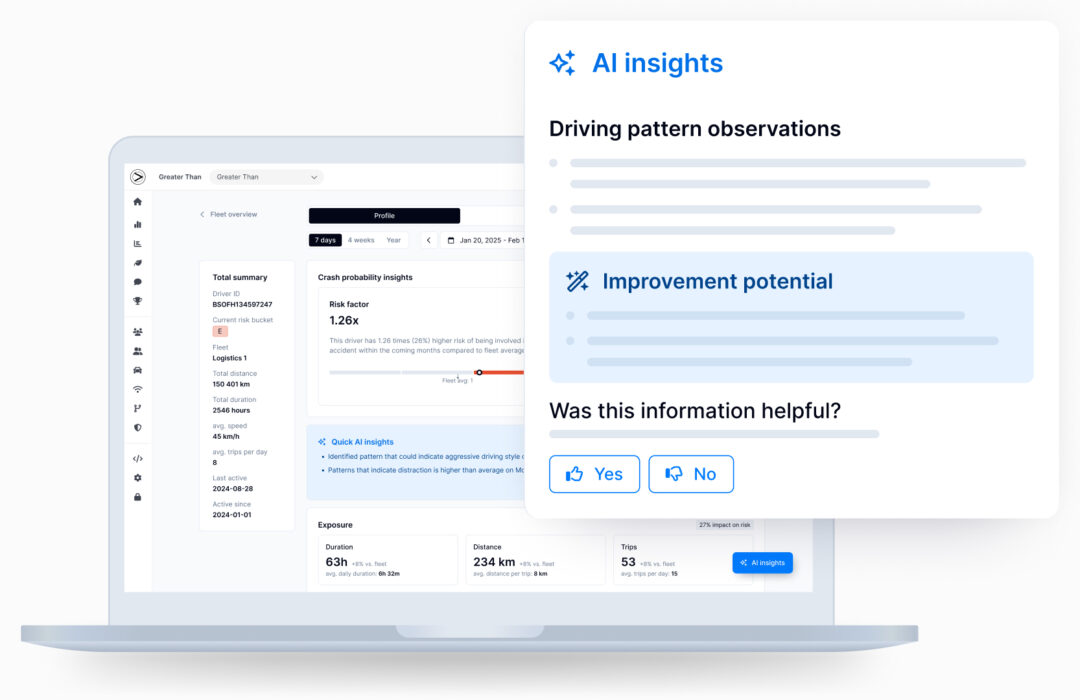
AI Coach: Your integrated coaching solution
Located within the Crash Probability Hub, AI Coach is the first AI coaching solution to provide contextualized, behavior-based feedback based on individual driver risk profiles.
- Equips managers with personalized data-driven feedback for drivers at required intervals
- Strengthens safety interventions, reduces workload and saves time
- Can be integrated directly into apps
Book a demo
Get in touch for a no obligation walkthrough of how our products can help your business.