Team working, looking at analytics reports at a dashboard

Analytics reports

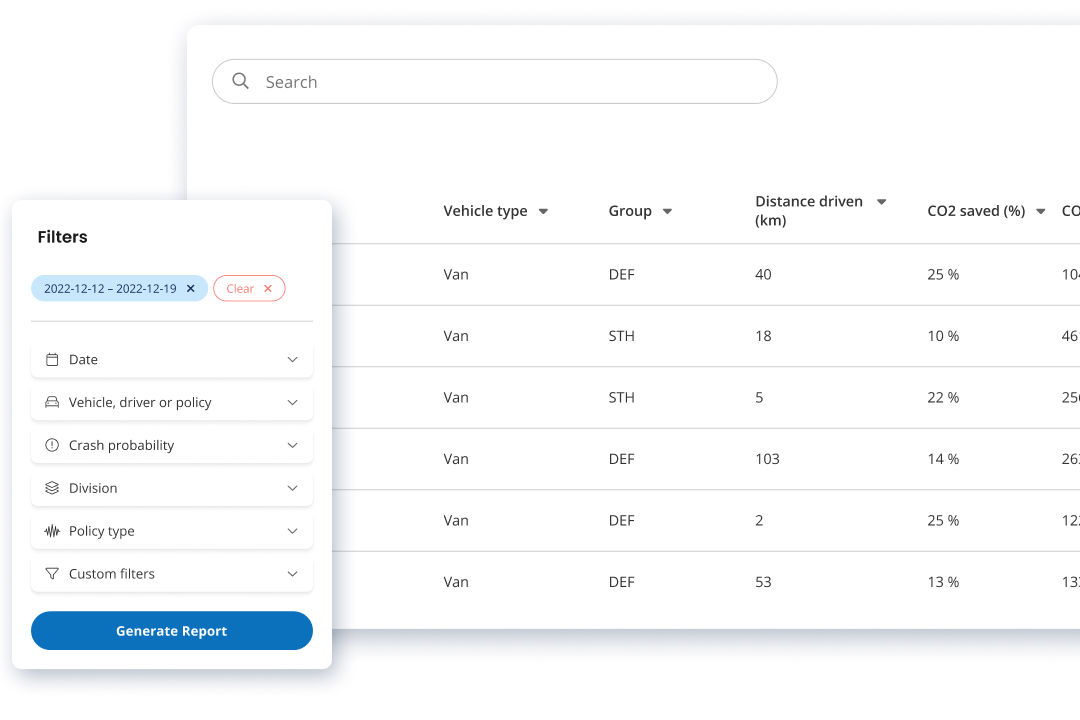
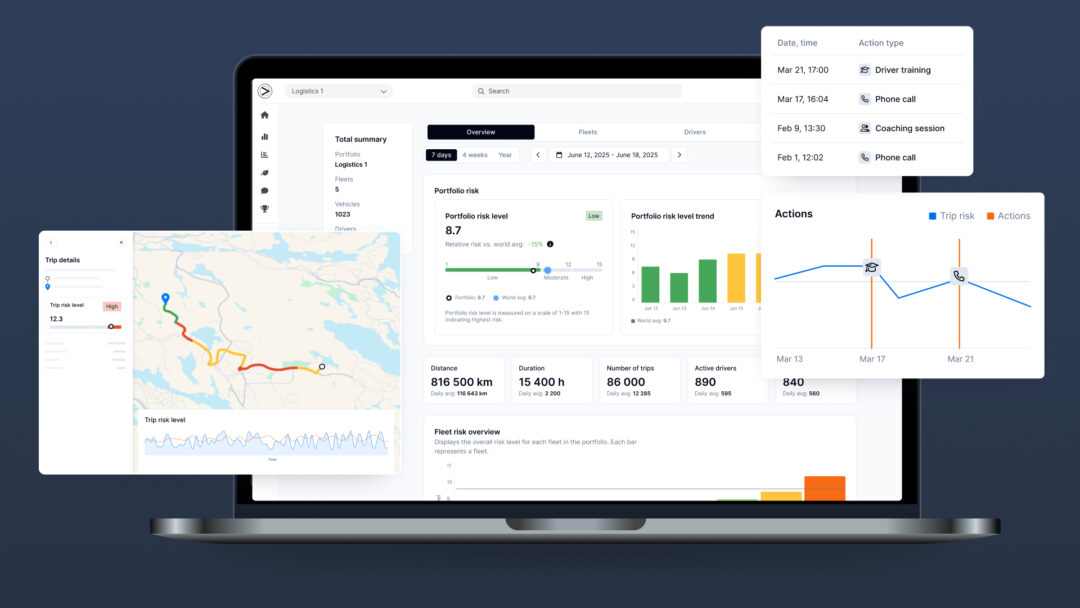
Dive deeper into the Crash Probability Score and Climate Impact Score with regular reports that summarize performance and trends. Receive insightful data-driven intelligence at a frequency of your choice to enable smarter, more profitable business decisions.

UI elements in sustainability report

Discover valuable insights

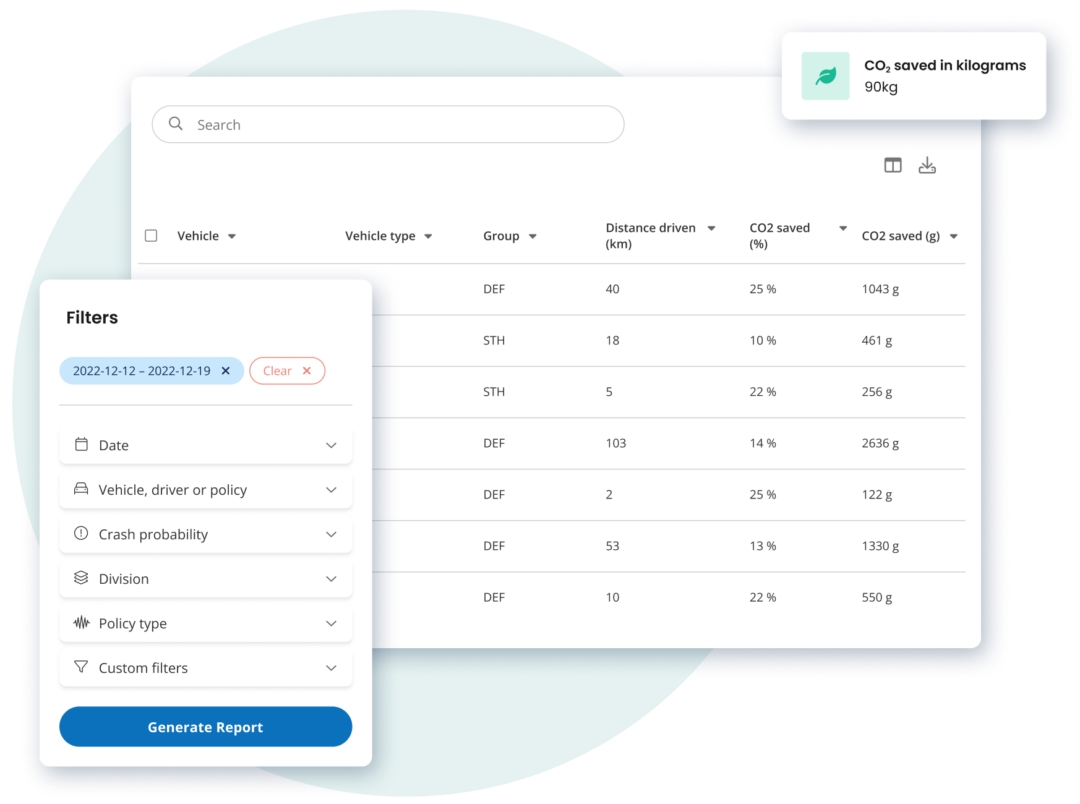
Truly understand crash probability and climate impact at the individual and organizational level. Our reports provide deep insights with easy access so you can quickly identify:

  • Changes in performance over time
  • Reasons for change
  • Opportunities for intervention
Aerial view of traffic in intersection

Customize what matters

Benefit from the data-driven intelligence that matters most to you, without the need to allocate precious resources to data analysis. With our crash probability or climate impact reports, you can:

  • Deep dive into specific KPIs, for example crash risk by zip code or crash risk by time of day
  • Filter for a specific time period for a complete snapshot of risk
  • Customize the reports to suit your needs

Add-ons and Score to measure, act and report on the data

Visual overview of crash probability and risk trends.

Real-time insights to quantify climate impact.

Your solution to measure, act and report on crash probability and climate impact.

Book a demo

A free walkthrough is a great way to get started if you are interested in understanding how our products can help your business.

A table with mobility driving data and filtering

Enter your details for a free walkthrough